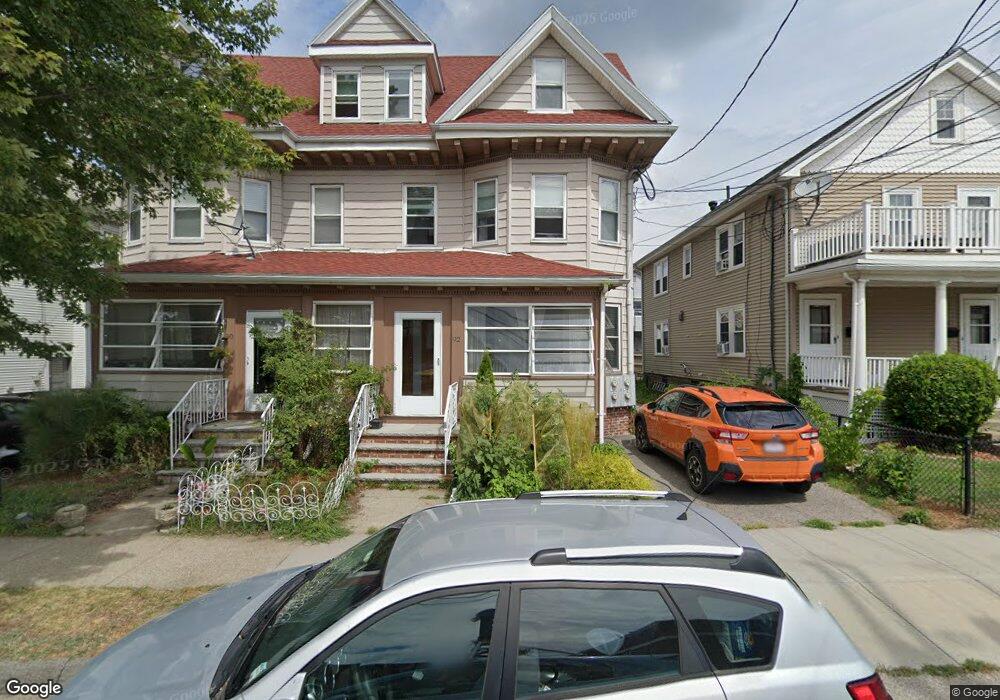
92 Cypress St Unit A Watertown, MA 02472
East Watertown NeighborhoodEstimated Value: $580,402 - $671,000
2
Beds
1
Bath
910
Sq Ft
$684/Sq Ft
Est. Value
About This Home
This home is located at 92 Cypress St Unit A, Watertown, MA 02472 and is currently estimated at $622,101, approximately $683 per square foot. 92 Cypress St Unit A is a home located in Middlesex County with nearby schools including St. Stephen's Armenian Elementary School, Atrium School, and The Kendall School.
Ownership History
Date
Name
Owned For
Owner Type
Purchase Details
Closed on
Jun 26, 2023
Sold by
Wallas Amanda and Weaver Kevin
Bought by
Johnstone Matthew and Wood Julia
Current Estimated Value
Home Financials for this Owner
Home Financials are based on the most recent Mortgage that was taken out on this home.
Original Mortgage
$463,250
Outstanding Balance
$451,266
Interest Rate
6.35%
Mortgage Type
Purchase Money Mortgage
Estimated Equity
$170,835
Purchase Details
Closed on
Nov 12, 2019
Sold by
Roderick Elizabeth S
Bought by
Wallas Amanda
Home Financials for this Owner
Home Financials are based on the most recent Mortgage that was taken out on this home.
Original Mortgage
$341,250
Interest Rate
3.65%
Mortgage Type
New Conventional
Purchase Details
Closed on
Jul 31, 2018
Sold by
Jones Angela R
Bought by
Roderick Elizabeth S
Purchase Details
Closed on
Nov 16, 2007
Sold by
Irqsusi Mohammad Ali and Irqsusi Taghreed A
Bought by
Jones Angela R
Home Financials for this Owner
Home Financials are based on the most recent Mortgage that was taken out on this home.
Original Mortgage
$151,500
Interest Rate
6.41%
Mortgage Type
Purchase Money Mortgage
Create a Home Valuation Report for This Property
The Home Valuation Report is an in-depth analysis detailing your home's value as well as a comparison with similar homes in the area
Home Values in the Area
Average Home Value in this Area
Purchase History
| Date | Buyer | Sale Price | Title Company |
|---|---|---|---|
| Johnstone Matthew | $545,000 | None Available | |
| Wallas Amanda | $455,000 | -- | |
| Roderick Elizabeth S | $425,000 | -- | |
| Jones Angela R | $192,500 | -- |
Source: Public Records
Mortgage History
| Date | Status | Borrower | Loan Amount |
|---|---|---|---|
| Open | Johnstone Matthew | $463,250 | |
| Previous Owner | Wallas Amanda | $341,250 | |
| Previous Owner | Jones Angela R | $151,500 |
Source: Public Records
Tax History Compared to Growth
Tax History
| Year | Tax Paid | Tax Assessment Tax Assessment Total Assessment is a certain percentage of the fair market value that is determined by local assessors to be the total taxable value of land and additions on the property. | Land | Improvement |
|---|---|---|---|---|
| 2025 | $5,844 | $500,300 | $0 | $500,300 |
| 2024 | $5,483 | $468,600 | $0 | $468,600 |
| 2023 | $6,069 | $446,900 | $0 | $446,900 |
| 2022 | $5,413 | $408,500 | $0 | $408,500 |
| 2021 | $4,922 | $401,800 | $0 | $401,800 |
| 2020 | $4,838 | $398,500 | $0 | $398,500 |
| 2019 | $4,035 | $313,300 | $0 | $313,300 |
| 2018 | $3,870 | $287,300 | $0 | $287,300 |
| 2017 | $3,825 | $275,400 | $0 | $275,400 |
| 2016 | $3,456 | $252,600 | $0 | $252,600 |
| 2015 | $3,742 | $249,000 | $0 | $249,000 |
| 2014 | $3,511 | $234,700 | $0 | $234,700 |
Source: Public Records
Map
Nearby Homes
- 180-182 Walnut St
- 154 Cypress St
- 57 Quimby St
- 84 Boylston St
- 85 Dexter Ave Unit 87
- 85 Dexter Ave
- 24-26 Louise St
- 41 Paul St Unit 1
- 194 N Beacon St
- 235 Mount Auburn St
- 1 Clayton St
- 43 Irma Ave Unit 43
- 81 Winsor Ave
- 238 Arlington St Unit 238
- 11 Broadway Unit 11
- 14 Royal St
- 59 Riverview Rd
- 56-58 Edgecliff Rd
- 87 Templeton Pkwy Unit 3
- 133 Hillside Rd
- 92 Cypress St Unit 1B
- 92 Cypress St Unit 92
- 92 Cypress St
- 92 Cypress St Unit 90
- 92 Cypress St Unit 2
- 92 Cypress St Unit 1
- 90 Cypress St Unit A
- 90 Cypress St
- 90 Cypress St Unit 2
- 92 A Cypress St Unit A
- 90A Cypress St Unit 90A
- 96 Cypress St
- 94 Cypress St Unit 96
- 86 Cypress St Unit 88
- 86 Cypress St Unit 86-1
- 86 Cypress St Unit 86
- 86 Cypress St Unit 1
- 88 Cypress St Unit 88
- 98 Cypress St
- 7 Laurel St