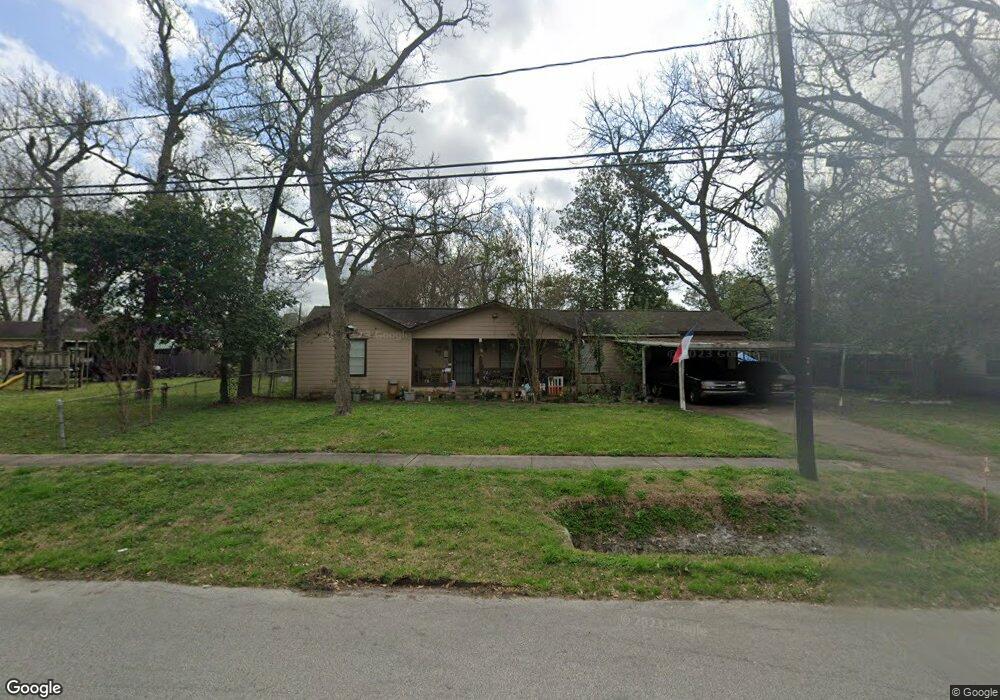
92 De Boll St Houston, TX 77022
Northside-Northline NeighborhoodEstimated Value: $207,042 - $231,000
3
Beds
1
Bath
1,223
Sq Ft
$182/Sq Ft
Est. Value
About This Home
This home is located at 92 De Boll St, Houston, TX 77022 and is currently estimated at $222,261, approximately $181 per square foot. 92 De Boll St is a home located in Harris County with nearby schools including Burbank Elementary School, Burbank Middle School, and Sam Houston Math, Science & Technology Center.
Ownership History
Date
Name
Owned For
Owner Type
Purchase Details
Closed on
Mar 23, 2001
Sold by
Wood Norma Ruth Howell
Bought by
Ledezma Maria D
Current Estimated Value
Home Financials for this Owner
Home Financials are based on the most recent Mortgage that was taken out on this home.
Original Mortgage
$34,000
Outstanding Balance
$12,316
Interest Rate
6.95%
Mortgage Type
Seller Take Back
Estimated Equity
$209,945
Purchase Details
Closed on
Jul 18, 1997
Sold by
Baxter Ed Allen
Bought by
Baxter Norma Ruth Howell
Create a Home Valuation Report for This Property
The Home Valuation Report is an in-depth analysis detailing your home's value as well as a comparison with similar homes in the area
Home Values in the Area
Average Home Value in this Area
Purchase History
| Date | Buyer | Sale Price | Title Company |
|---|---|---|---|
| Ledezma Maria D | -- | -- | |
| Baxter Norma Ruth Howell | -- | -- |
Source: Public Records
Mortgage History
| Date | Status | Borrower | Loan Amount |
|---|---|---|---|
| Open | Ledezma Maria D | $34,000 |
Source: Public Records
Tax History Compared to Growth
Tax History
| Year | Tax Paid | Tax Assessment Tax Assessment Total Assessment is a certain percentage of the fair market value that is determined by local assessors to be the total taxable value of land and additions on the property. | Land | Improvement |
|---|---|---|---|---|
| 2025 | $4,205 | $230,573 | $117,653 | $112,920 |
| 2024 | $4,205 | $200,961 | $83,659 | $117,302 |
| 2023 | $4,205 | $190,736 | $83,659 | $107,077 |
| 2022 | $3,199 | $145,288 | $60,553 | $84,735 |
| 2021 | $3,110 | $133,438 | $60,553 | $72,885 |
| 2020 | $2,812 | $116,111 | $60,553 | $55,558 |
| 2019 | $2,201 | $93,356 | $38,901 | $54,455 |
| 2018 | $2,175 | $85,965 | $41,830 | $44,135 |
| 2017 | $2,174 | $85,965 | $41,830 | $44,135 |
| 2016 | $2,174 | $85,965 | $41,830 | $44,135 |
| 2015 | -- | $59,921 | $41,830 | $18,091 |
| 2014 | -- | $59,921 | $41,830 | $18,091 |
Source: Public Records
Map
Nearby Homes
- 90 Burress St Unit B
- 90 Burress St Unit A
- 70 Burress St
- 108 Fichter St
- 61 Trenwood Ln
- 44 Farrell St
- 216 Burress St
- 56 Wellford St
- 45 Wellford St
- 132 Grothe Ln
- 249 De Boll St
- 253 De Boll St
- 9625 Fulton St
- 202 Burbank St
- 91 Burbank St
- 318 Charlock St
- Cypress Plan at Wellford Village
- Willow Plan at Wellford Village
- 110 Luetta St
- 108 Luetta St