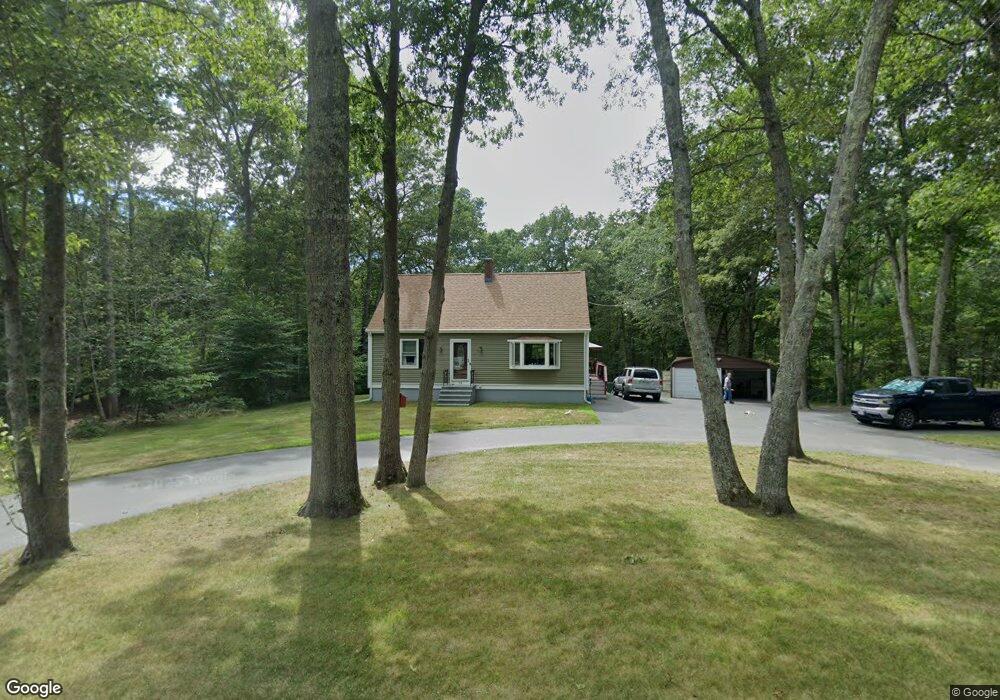
92 Gorham St Rehoboth, MA 02769
Estimated Value: $559,295 - $744,000
4
Beds
1
Bath
1,778
Sq Ft
$353/Sq Ft
Est. Value
About This Home
This home is located at 92 Gorham St, Rehoboth, MA 02769 and is currently estimated at $627,824, approximately $353 per square foot. 92 Gorham St is a home located in Bristol County with nearby schools including Dighton-Rehoboth Regional High School and Cedar Brook School.
Ownership History
Date
Name
Owned For
Owner Type
Purchase Details
Closed on
Oct 21, 2025
Sold by
Klang Denise C and Klang Leon F
Bought by
Klanf
Current Estimated Value
Purchase Details
Closed on
Dec 21, 1990
Sold by
Levine Edward E
Bought by
Klang Leon F
Home Financials for this Owner
Home Financials are based on the most recent Mortgage that was taken out on this home.
Original Mortgage
$106,000
Interest Rate
10.02%
Mortgage Type
Purchase Money Mortgage
Create a Home Valuation Report for This Property
The Home Valuation Report is an in-depth analysis detailing your home's value as well as a comparison with similar homes in the area
Home Values in the Area
Average Home Value in this Area
Purchase History
| Date | Buyer | Sale Price | Title Company |
|---|---|---|---|
| Klanf | -- | -- | |
| Klang Leon F | $140,000 | -- |
Source: Public Records
Mortgage History
| Date | Status | Borrower | Loan Amount |
|---|---|---|---|
| Previous Owner | Klang Leon F | $10,000 | |
| Previous Owner | Klang Leon F | $106,500 | |
| Previous Owner | Klang Leon F | $106,000 |
Source: Public Records
Tax History
| Year | Tax Paid | Tax Assessment Tax Assessment Total Assessment is a certain percentage of the fair market value that is determined by local assessors to be the total taxable value of land and additions on the property. | Land | Improvement |
|---|---|---|---|---|
| 2025 | $48 | $427,000 | $191,700 | $235,300 |
| 2024 | $4,447 | $391,500 | $191,700 | $199,800 |
| 2023 | $4,231 | $391,500 | $187,700 | $203,800 |
| 2022 | $4,231 | $333,900 | $179,300 | $154,600 |
| 2021 | $4,205 | $317,600 | $163,000 | $154,600 |
| 2020 | $4,097 | $312,300 | $163,000 | $149,300 |
| 2018 | $3,405 | $284,500 | $155,200 | $129,300 |
| 2017 | $3,343 | $266,200 | $155,200 | $111,000 |
| 2016 | $3,169 | $260,800 | $155,200 | $105,600 |
| 2015 | $3,378 | $274,400 | $148,000 | $126,400 |
| 2014 | $3,208 | $257,900 | $140,800 | $117,100 |
Source: Public Records
Map
Nearby Homes
Your Personal Tour Guide
Ask me questions while you tour the home.