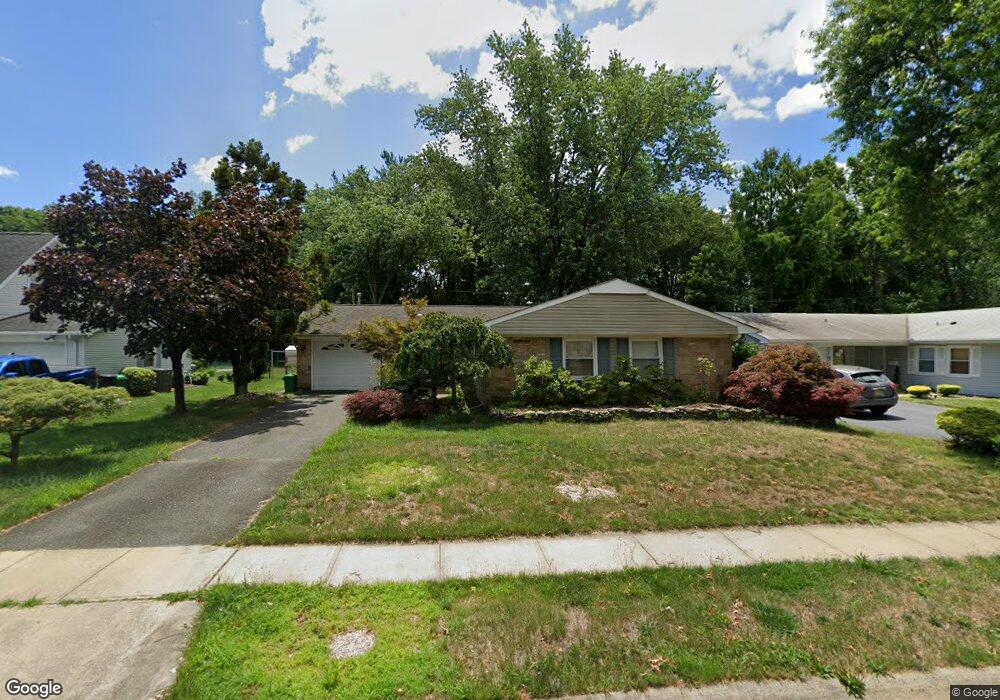
92 Idlewild Ln Matawan, NJ 07747
Estimated Value: $664,402 - $704,000
3
Beds
2
Baths
1,535
Sq Ft
$442/Sq Ft
Est. Value
About This Home
This home is located at 92 Idlewild Ln, Matawan, NJ 07747 and is currently estimated at $678,851, approximately $442 per square foot. 92 Idlewild Ln is a home located in Monmouth County with nearby schools including Matawan Reg High School, St Benedict School, and St. Joseph Elementary School.
Ownership History
Date
Name
Owned For
Owner Type
Purchase Details
Closed on
Jul 19, 2002
Sold by
Melendez Albert
Bought by
Pollitto Daurie and Stoll Noel
Current Estimated Value
Home Financials for this Owner
Home Financials are based on the most recent Mortgage that was taken out on this home.
Original Mortgage
$150,000
Outstanding Balance
$63,272
Interest Rate
6.64%
Estimated Equity
$615,579
Purchase Details
Closed on
Jun 23, 1995
Sold by
Leff Gary
Bought by
Melendez Albert and Melendez Karen
Home Financials for this Owner
Home Financials are based on the most recent Mortgage that was taken out on this home.
Original Mortgage
$135,000
Interest Rate
7.7%
Create a Home Valuation Report for This Property
The Home Valuation Report is an in-depth analysis detailing your home's value as well as a comparison with similar homes in the area
Home Values in the Area
Average Home Value in this Area
Purchase History
| Date | Buyer | Sale Price | Title Company |
|---|---|---|---|
| Pollitto Daurie | $280,000 | -- | |
| Melendez Albert | $150,500 | -- |
Source: Public Records
Mortgage History
| Date | Status | Borrower | Loan Amount |
|---|---|---|---|
| Open | Pollitto Daurie | $150,000 | |
| Previous Owner | Melendez Albert | $135,000 |
Source: Public Records
Tax History Compared to Growth
Tax History
| Year | Tax Paid | Tax Assessment Tax Assessment Total Assessment is a certain percentage of the fair market value that is determined by local assessors to be the total taxable value of land and additions on the property. | Land | Improvement |
|---|---|---|---|---|
| 2025 | $10,552 | $593,600 | $432,400 | $161,200 |
| 2024 | $10,051 | $522,100 | $363,900 | $158,200 |
| 2023 | $10,051 | $469,900 | $315,400 | $154,500 |
| 2022 | $8,789 | $392,000 | $244,900 | $147,100 |
| 2021 | $8,789 | $352,000 | $221,100 | $130,900 |
| 2020 | $9,743 | $359,000 | $231,100 | $127,900 |
| 2019 | $9,620 | $344,300 | $217,100 | $127,200 |
| 2018 | $9,194 | $329,900 | $208,600 | $121,300 |
| 2017 | $8,758 | $318,700 | $188,600 | $130,100 |
| 2016 | $8,149 | $309,500 | $182,600 | $126,900 |
| 2015 | $8,591 | $313,200 | $189,600 | $123,600 |
| 2014 | $8,161 | $303,400 | $180,600 | $122,800 |
Source: Public Records
Map
Nearby Homes
- 13 Ivy Hill Dr
- 2 Avondale Ln
- 3 Avondale Ln
- 111 Courtland Ln
- 9 Idolstone Ln
- 108 Dundee Ct
- 106 van Brackle Rd
- 129 Dumbarton Hill Ct
- 75 Bradford Ct Unit 75
- 68 Bradford Ct
- 141 Eastwick Ct Unit 141
- 31 Balmoral Ct
- 9 Tralee Rd
- 537 S Atlantic Ave
- 223 Perth Hill Ct Unit 223
- 12 S Atlantic Ave Unit 14
- 184 Edinburgh Ct Unit 184
- 101 Cresci Blvd
- 30 Oxford Ln
- 315 Wellington Place