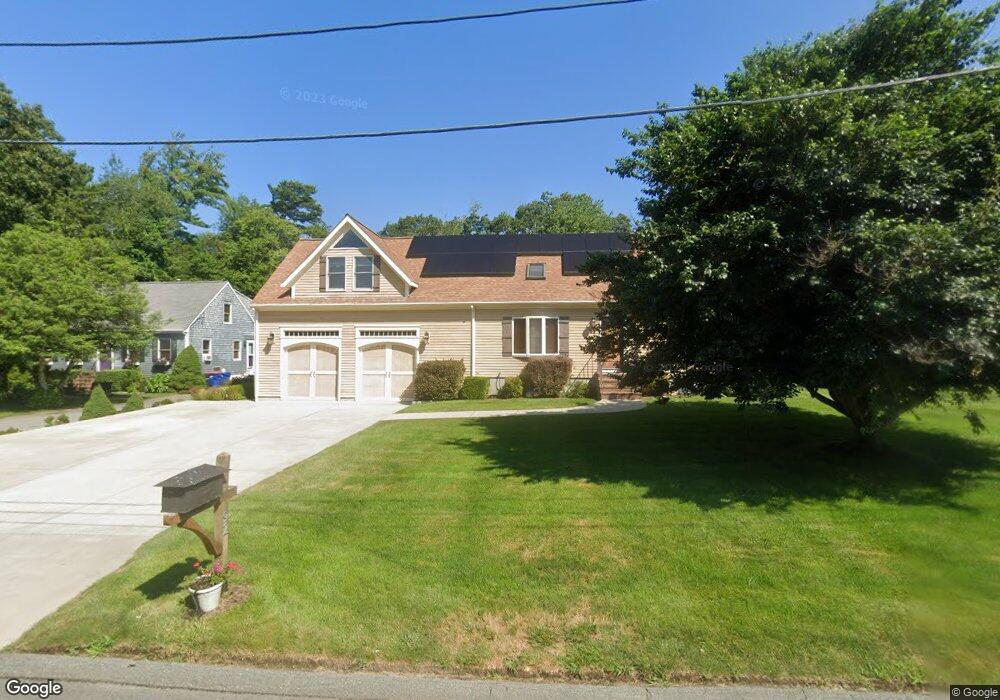
92 Long Rd Fairhaven, MA 02719
Oxford NeighborhoodEstimated Value: $440,000 - $732,000
3
Beds
2
Baths
2,309
Sq Ft
$254/Sq Ft
Est. Value
About This Home
This home is located at 92 Long Rd, Fairhaven, MA 02719 and is currently estimated at $587,172, approximately $254 per square foot. 92 Long Rd is a home located in Bristol County with nearby schools including Fairhaven High School, Alma Del Mar Charter School, and City On A Hill Charter Public School New Bedford.
Ownership History
Date
Name
Owned For
Owner Type
Purchase Details
Closed on
Jan 23, 2002
Sold by
Est Schonheinz Nancy L and Schonheinz Frederick C
Bought by
Schonheinz Paula J
Current Estimated Value
Home Financials for this Owner
Home Financials are based on the most recent Mortgage that was taken out on this home.
Original Mortgage
$120,000
Outstanding Balance
$49,177
Interest Rate
7.08%
Mortgage Type
Purchase Money Mortgage
Estimated Equity
$537,995
Purchase Details
Closed on
Oct 19, 1999
Sold by
Sakonnet Prop Inc
Bought by
Schonheinz Nancy L
Create a Home Valuation Report for This Property
The Home Valuation Report is an in-depth analysis detailing your home's value as well as a comparison with similar homes in the area
Home Values in the Area
Average Home Value in this Area
Purchase History
| Date | Buyer | Sale Price | Title Company |
|---|---|---|---|
| Schonheinz Paula J | $150,000 | -- | |
| Schonheinz Nancy L | $1,350 | -- |
Source: Public Records
Mortgage History
| Date | Status | Borrower | Loan Amount |
|---|---|---|---|
| Open | Schonheinz Paula J | $120,000 |
Source: Public Records
Tax History
| Year | Tax Paid | Tax Assessment Tax Assessment Total Assessment is a certain percentage of the fair market value that is determined by local assessors to be the total taxable value of land and additions on the property. | Land | Improvement |
|---|---|---|---|---|
| 2025 | $50 | $531,100 | $192,000 | $339,100 |
| 2024 | $4,761 | $515,800 | $192,000 | $323,800 |
| 2023 | $4,542 | $456,500 | $178,100 | $278,400 |
| 2022 | $4,461 | $436,500 | $169,800 | $266,700 |
| 2021 | $4,445 | $393,700 | $154,500 | $239,200 |
| 2020 | $4,278 | $386,800 | $147,600 | $239,200 |
| 2019 | $4,255 | $364,600 | $134,500 | $230,100 |
| 2018 | $4,111 | $349,900 | $128,200 | $221,700 |
| 2017 | $4,133 | $343,300 | $128,200 | $215,100 |
| 2016 | $4,124 | $338,600 | $128,200 | $210,400 |
| 2015 | $3,939 | $324,200 | $128,200 | $196,000 |
Source: Public Records
Map
Nearby Homes
Your Personal Tour Guide
Ask me questions while you tour the home.