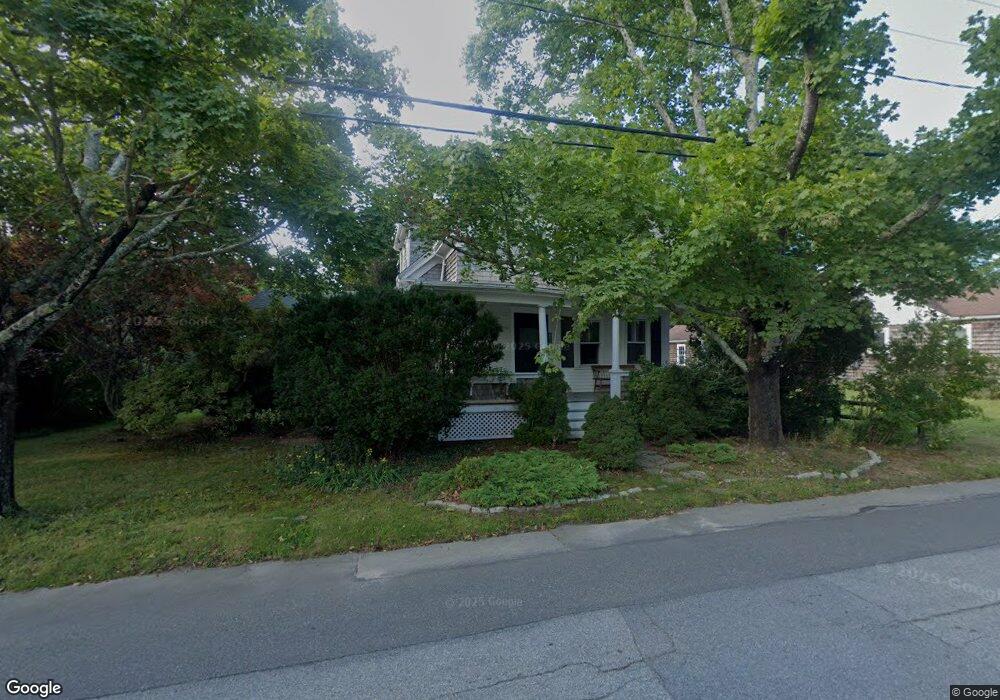
92 Main St Marion, MA 02738
Marion Center NeighborhoodEstimated Value: $763,269 - $892,000
3
Beds
2
Baths
1,408
Sq Ft
$578/Sq Ft
Est. Value
About This Home
This home is located at 92 Main St, Marion, MA 02738 and is currently estimated at $814,067, approximately $578 per square foot. 92 Main St is a home located in Plymouth County with nearby schools including Old Rochester Regional High School and Tabor Academy.
Ownership History
Date
Name
Owned For
Owner Type
Purchase Details
Closed on
Oct 31, 2007
Sold by
Reddick Susan
Bought by
Reddick Susan E and Gabriel Charles W
Current Estimated Value
Purchase Details
Closed on
Oct 10, 2003
Sold by
Gelerman Richard A
Bought by
Reddick Susan
Home Financials for this Owner
Home Financials are based on the most recent Mortgage that was taken out on this home.
Original Mortgage
$310,000
Interest Rate
6.35%
Mortgage Type
Purchase Money Mortgage
Create a Home Valuation Report for This Property
The Home Valuation Report is an in-depth analysis detailing your home's value as well as a comparison with similar homes in the area
Home Values in the Area
Average Home Value in this Area
Purchase History
| Date | Buyer | Sale Price | Title Company |
|---|---|---|---|
| Reddick Susan E | -- | -- | |
| Reddick Susan | $390,000 | -- |
Source: Public Records
Mortgage History
| Date | Status | Borrower | Loan Amount |
|---|---|---|---|
| Previous Owner | Reddick Susan | $40,000 | |
| Previous Owner | Reddick Susan | $310,000 | |
| Previous Owner | Reddick Susan | $168,000 |
Source: Public Records
Tax History
| Year | Tax Paid | Tax Assessment Tax Assessment Total Assessment is a certain percentage of the fair market value that is determined by local assessors to be the total taxable value of land and additions on the property. | Land | Improvement |
|---|---|---|---|---|
| 2025 | $6,348 | $681,100 | $432,100 | $249,000 |
| 2024 | $6,324 | $682,900 | $473,300 | $209,600 |
| 2023 | $4,665 | $494,200 | $298,400 | $195,800 |
| 2022 | $5,279 | $486,500 | $277,000 | $209,500 |
| 2021 | $4,866 | $429,900 | $230,200 | $199,700 |
| 2020 | $0 | $402,300 | $230,200 | $172,100 |
| 2019 | $4,644 | $421,000 | $248,900 | $172,100 |
| 2018 | $3,587 | $313,300 | $188,900 | $124,400 |
| 2017 | $3,575 | $313,300 | $188,900 | $124,400 |
| 2016 | $3,488 | $308,400 | $188,900 | $119,500 |
| 2015 | $3,269 | $294,200 | $160,100 | $134,100 |
Source: Public Records
Map
Nearby Homes
Your Personal Tour Guide
Ask me questions while you tour the home.