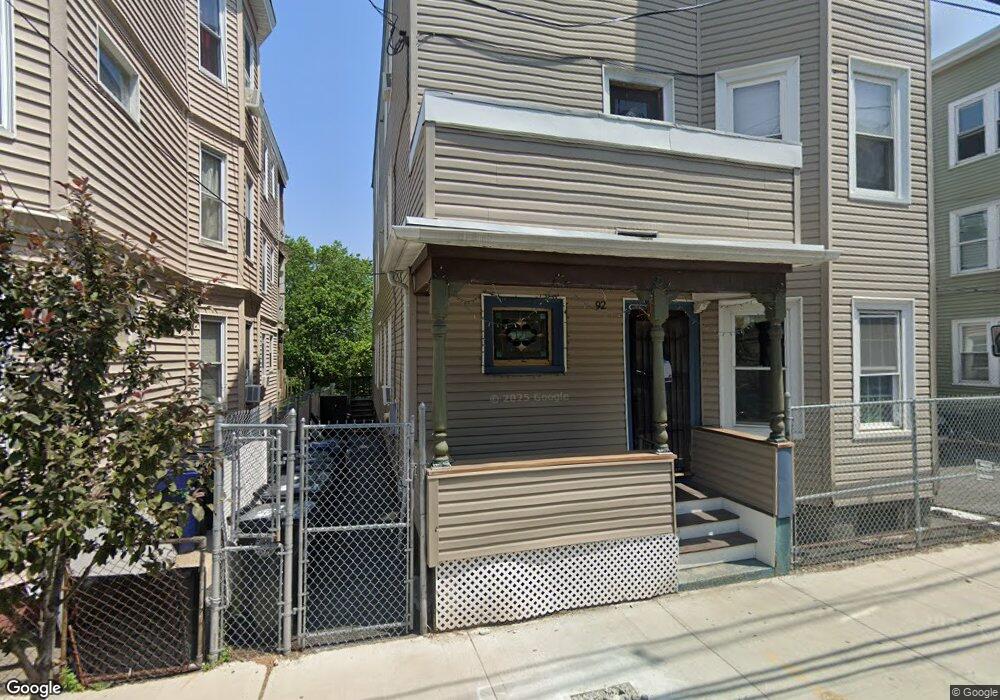
92 Marlborough St Chelsea, MA 02150
Bellingham Square NeighborhoodEstimated Value: $898,000 - $1,411,000
6
Beds
3
Baths
4,128
Sq Ft
$258/Sq Ft
Est. Value
About This Home
This home is located at 92 Marlborough St, Chelsea, MA 02150 and is currently estimated at $1,065,199, approximately $258 per square foot. 92 Marlborough St is a home located in Suffolk County with nearby schools including Chelsea High School and Phoenix Charter Academy - Chelsea.
Ownership History
Date
Name
Owned For
Owner Type
Purchase Details
Closed on
Mar 2, 2004
Sold by
Mcgauley Grace M and Obrien Grace M
Bought by
Flores Jose R
Current Estimated Value
Home Financials for this Owner
Home Financials are based on the most recent Mortgage that was taken out on this home.
Original Mortgage
$307,999
Outstanding Balance
$143,743
Interest Rate
5.65%
Mortgage Type
Purchase Money Mortgage
Estimated Equity
$921,456
Create a Home Valuation Report for This Property
The Home Valuation Report is an in-depth analysis detailing your home's value as well as a comparison with similar homes in the area
Home Values in the Area
Average Home Value in this Area
Purchase History
| Date | Buyer | Sale Price | Title Company |
|---|---|---|---|
| Flores Jose R | $400,000 | -- | |
| Flores Jose R | $400,000 | -- |
Source: Public Records
Mortgage History
| Date | Status | Borrower | Loan Amount |
|---|---|---|---|
| Open | Flores Jose R | $307,999 | |
| Closed | Flores Jose R | $307,999 |
Source: Public Records
Tax History Compared to Growth
Tax History
| Year | Tax Paid | Tax Assessment Tax Assessment Total Assessment is a certain percentage of the fair market value that is determined by local assessors to be the total taxable value of land and additions on the property. | Land | Improvement |
|---|---|---|---|---|
| 2025 | $10,099 | $877,400 | $155,800 | $721,600 |
| 2024 | $10,441 | $877,400 | $155,800 | $721,600 |
| 2023 | $10,022 | $809,500 | $141,700 | $667,800 |
| 2022 | $10,120 | $763,800 | $134,900 | $628,900 |
| 2021 | $9,752 | $716,000 | $128,500 | $587,500 |
| 2020 | $9,056 | $676,300 | $122,400 | $553,900 |
| 2019 | $8,255 | $579,300 | $122,400 | $456,900 |
| 2018 | $7,410 | $525,500 | $122,400 | $403,100 |
| 2017 | $7,038 | $490,800 | $122,400 | $368,400 |
| 2016 | $5,780 | $405,600 | $122,400 | $283,200 |
| 2015 | $5,026 | $349,000 | $106,400 | $242,600 |
| 2014 | $4,358 | $292,900 | $92,500 | $200,400 |
Source: Public Records
Map
Nearby Homes
- 110 Bellingham St Unit 1
- 110 Bellingham St Unit 3
- 144 Library St
- 29 Cottage St
- 70 Chester Ave Unit 72
- 221 Shurtleff St Unit 2
- 39 Cary Ave Unit 14
- 33 Cary Ave Unit 11
- 50 Maverick St Unit 3
- 175 Cottage St Unit 312
- 165 Cottage St Unit 611
- 165 Cottage St Unit 711
- 230 Chestnut St
- 250 Congress Ave Unit 40
- 173 Walnut St Unit 3
- 65 6th St
- 139 Park St Unit 4
- 84 Tudor St Unit 4
- 163 Chestnut St
- 55 Eleanor St Unit 17
- 96 Marlborough St
- 90 Marlborough St
- 90 Marlborough St Unit 2
- 90 Marlborough St Unit 3
- 90 Marlborough St Unit 1
- 86 Marlborough St
- 81 Library St
- 87 Marlborough St
- 87 Marlborough St Unit 3
- 87 Marlborough St Unit 2
- 82 Marlborough St
- 98 Marlborough St
- 85 Marlborough St
- 101 Marlborough St
- 101 Marlborough St Unit 1
- 95 Library St
- 100 Marlborough St
- 77 Library St
- 75 Marlborough St
- 75 Marlborough St Unit 2