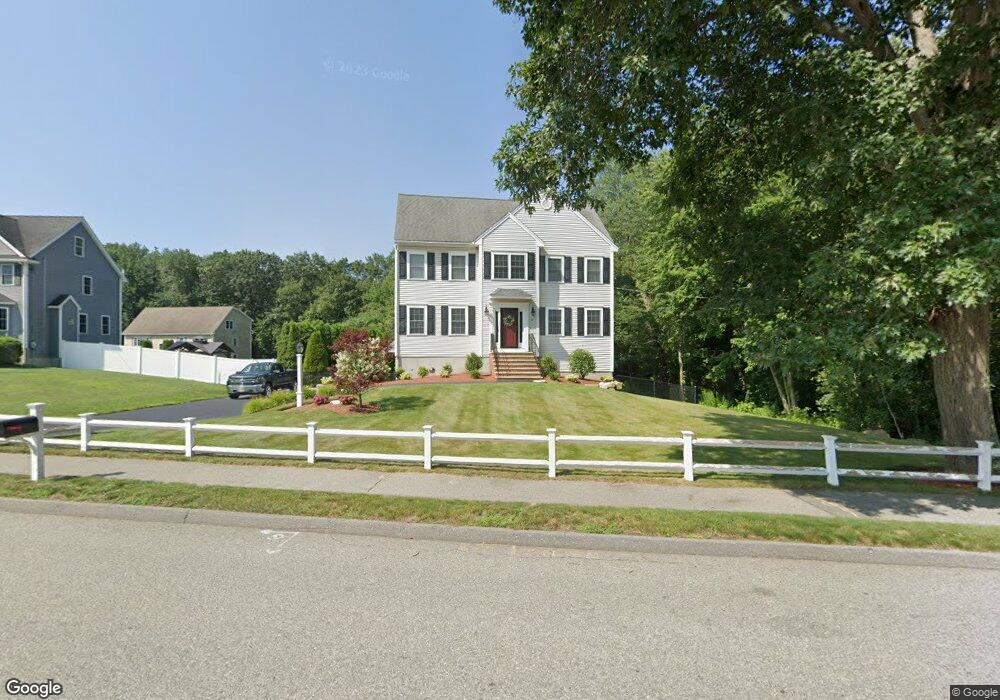
92 Mink Run Rd Wilmington, MA 01887
Estimated Value: $926,065 - $1,060,000
3
Beds
3
Baths
2,016
Sq Ft
$498/Sq Ft
Est. Value
About This Home
This home is located at 92 Mink Run Rd, Wilmington, MA 01887 and is currently estimated at $1,003,266, approximately $497 per square foot. 92 Mink Run Rd is a home located in Middlesex County with nearby schools including Wilmington Middle School, Wilmington High School, and Abundant Life Christian School and Childcare.
Ownership History
Date
Name
Owned For
Owner Type
Purchase Details
Closed on
Oct 25, 2004
Sold by
Bmc Bldrs Llc
Bought by
Allen Kathleen S
Current Estimated Value
Home Financials for this Owner
Home Financials are based on the most recent Mortgage that was taken out on this home.
Original Mortgage
$325,000
Outstanding Balance
$162,942
Interest Rate
5.85%
Estimated Equity
$840,324
Purchase Details
Closed on
Sep 20, 2004
Sold by
Bay State Land T
Bought by
Bmc Builders Llc
Home Financials for this Owner
Home Financials are based on the most recent Mortgage that was taken out on this home.
Original Mortgage
$325,000
Outstanding Balance
$162,942
Interest Rate
5.85%
Estimated Equity
$840,324
Create a Home Valuation Report for This Property
The Home Valuation Report is an in-depth analysis detailing your home's value as well as a comparison with similar homes in the area
Home Values in the Area
Average Home Value in this Area
Purchase History
| Date | Buyer | Sale Price | Title Company |
|---|---|---|---|
| Allen Kathleen S | $539,900 | -- | |
| Bmc Builders Llc | $155,000 | -- |
Source: Public Records
Mortgage History
| Date | Status | Borrower | Loan Amount |
|---|---|---|---|
| Open | Allen Kathleen S | $325,000 | |
| Closed | Bmc Builders Llc | $155,000 |
Source: Public Records
Tax History Compared to Growth
Tax History
| Year | Tax Paid | Tax Assessment Tax Assessment Total Assessment is a certain percentage of the fair market value that is determined by local assessors to be the total taxable value of land and additions on the property. | Land | Improvement |
|---|---|---|---|---|
| 2025 | $9,793 | $855,300 | $333,900 | $521,400 |
| 2024 | $9,542 | $834,800 | $333,900 | $500,900 |
| 2023 | $8,914 | $746,600 | $303,500 | $443,100 |
| 2022 | $8,402 | $644,800 | $252,900 | $391,900 |
| 2021 | $8,376 | $605,200 | $229,900 | $375,300 |
| 2020 | $8,128 | $598,500 | $229,900 | $368,600 |
| 2019 | $7,974 | $579,900 | $219,000 | $360,900 |
| 2018 | $7,645 | $530,500 | $208,500 | $322,000 |
| 2017 | $7,534 | $521,400 | $208,500 | $312,900 |
| 2016 | $7,084 | $484,200 | $198,600 | $285,600 |
| 2015 | $6,866 | $477,800 | $198,600 | $279,200 |
| 2014 | $6,436 | $452,000 | $189,100 | $262,900 |
Source: Public Records
Map
Nearby Homes