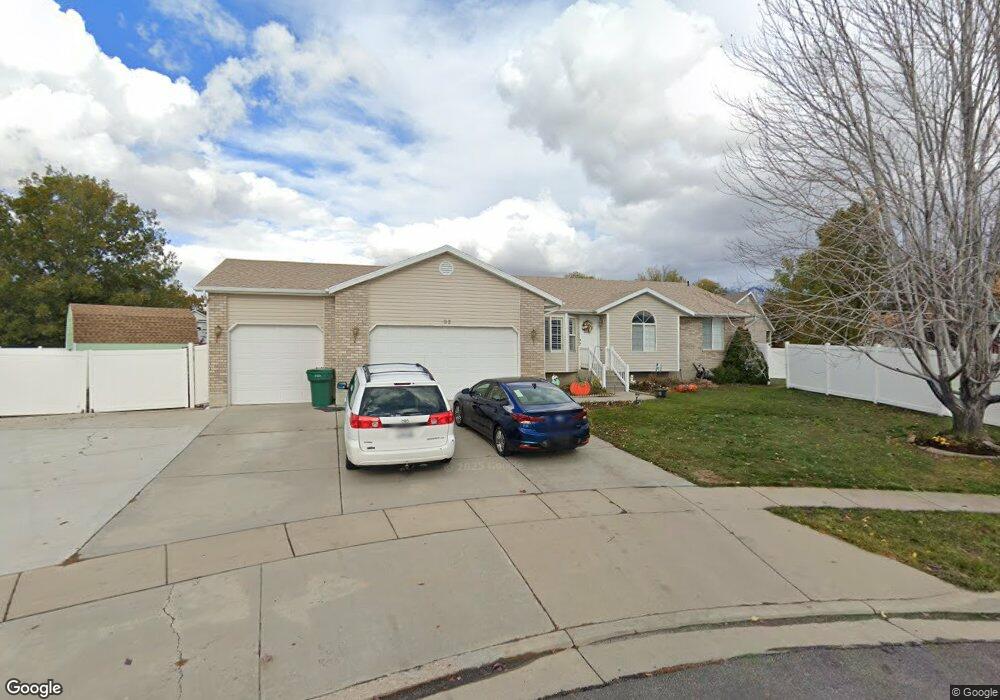
92 N 935 W Layton, UT 84041
Estimated Value: $554,000 - $602,009
5
Beds
3
Baths
1,489
Sq Ft
$388/Sq Ft
Est. Value
About This Home
This home is located at 92 N 935 W, Layton, UT 84041 and is currently estimated at $577,502, approximately $387 per square foot. 92 N 935 W is a home located in Davis County with nearby schools including Layton Elementary School, Fairfield Junior High School, and Layton High School.
Ownership History
Date
Name
Owned For
Owner Type
Purchase Details
Closed on
Nov 20, 2003
Sold by
Nichols Ryan and Nichols Kerith
Bought by
Mcbride Brent D and Mcbride Sally A
Current Estimated Value
Home Financials for this Owner
Home Financials are based on the most recent Mortgage that was taken out on this home.
Original Mortgage
$59,000
Interest Rate
5.89%
Mortgage Type
Purchase Money Mortgage
Purchase Details
Closed on
Jul 27, 2001
Sold by
Hallmark Homes & Development
Bought by
Nichols Ryan
Home Financials for this Owner
Home Financials are based on the most recent Mortgage that was taken out on this home.
Original Mortgage
$159,981
Interest Rate
7.09%
Purchase Details
Closed on
Jun 27, 2001
Sold by
Nichols Ryan
Bought by
Nichols Ryan and Nichols Kerith
Home Financials for this Owner
Home Financials are based on the most recent Mortgage that was taken out on this home.
Original Mortgage
$159,981
Interest Rate
7.09%
Create a Home Valuation Report for This Property
The Home Valuation Report is an in-depth analysis detailing your home's value as well as a comparison with similar homes in the area
Home Values in the Area
Average Home Value in this Area
Purchase History
| Date | Buyer | Sale Price | Title Company |
|---|---|---|---|
| Mcbride Brent D | -- | Monument Title Agency | |
| Nichols Ryan | -- | Merrill Title Company | |
| Nichols Ryan | -- | Merrill Title Company |
Source: Public Records
Mortgage History
| Date | Status | Borrower | Loan Amount |
|---|---|---|---|
| Closed | Mcbride Brent D | $59,000 | |
| Previous Owner | Nichols Ryan | $159,981 |
Source: Public Records
Tax History Compared to Growth
Tax History
| Year | Tax Paid | Tax Assessment Tax Assessment Total Assessment is a certain percentage of the fair market value that is determined by local assessors to be the total taxable value of land and additions on the property. | Land | Improvement |
|---|---|---|---|---|
| 2025 | $2,887 | $303,051 | $148,913 | $154,138 |
| 2024 | $2,793 | $295,350 | $155,865 | $139,485 |
| 2023 | $2,688 | $501,000 | $172,477 | $328,523 |
| 2022 | $2,951 | $298,650 | $95,607 | $203,043 |
| 2021 | $2,623 | $396,000 | $143,353 | $252,647 |
| 2020 | $2,520 | $365,000 | $123,797 | $241,203 |
| 2019 | $2,475 | $351,000 | $119,171 | $231,829 |
| 2018 | $2,261 | $322,000 | $105,371 | $216,629 |
| 2016 | $1,967 | $144,485 | $45,478 | $99,007 |
| 2015 | $1,924 | $134,200 | $45,478 | $88,722 |
| 2014 | $1,964 | $140,034 | $45,478 | $94,556 |
| 2013 | -- | $128,036 | $31,905 | $96,131 |
Source: Public Records
Map
Nearby Homes
- 933 W Gentile St
- 750 W Gentile St
- 296 S 950 W
- 485 W 100 N
- 362 S 950 W
- 1015 W 350 S
- 526 King St Unit 2
- 356 W 25 N
- 355 W Gentile St
- Browning Plan at Amber Fields
- Rhapsody Plan at Amber Fields
- Accord Plan at Amber Fields
- Timpani Plan at Amber Fields
- Octave Plan at Amber Fields
- Tempo Plan at Amber Fields
- Harvard Plan at Amber Fields
- Fortissimo Plan at Amber Fields
- Forte Plan at Amber Fields
- Interlude Plan at Amber Fields
- Concerto Plan at Amber Fields