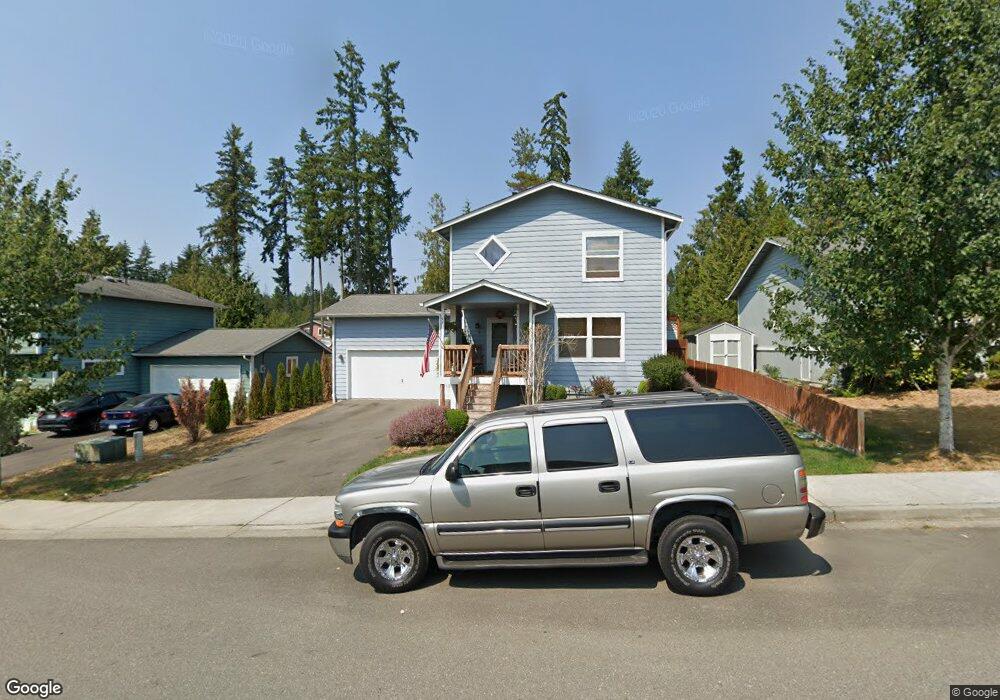
92 NE Max William Loop Poulsbo, WA 98370
Estimated Value: $484,000 - $508,000
3
Beds
2
Baths
1,232
Sq Ft
$401/Sq Ft
Est. Value
About This Home
This home is located at 92 NE Max William Loop, Poulsbo, WA 98370 and is currently estimated at $494,621, approximately $401 per square foot. 92 NE Max William Loop is a home located in Kitsap County with nearby schools including Vinland Elementary School, Poulsbo Middle School, and North Kitsap High School.
Ownership History
Date
Name
Owned For
Owner Type
Purchase Details
Closed on
Oct 27, 2016
Sold by
Shannon David A and Shannon Michelle C
Bought by
Shannon David A and Shannon Michelle C
Current Estimated Value
Home Financials for this Owner
Home Financials are based on the most recent Mortgage that was taken out on this home.
Original Mortgage
$219,775
Outstanding Balance
$176,441
Interest Rate
3.42%
Mortgage Type
VA
Estimated Equity
$318,180
Purchase Details
Closed on
Jan 16, 2009
Sold by
Shannon Michelle C
Bought by
Shannon David A and Shannon Michelle C
Home Financials for this Owner
Home Financials are based on the most recent Mortgage that was taken out on this home.
Original Mortgage
$192,000
Interest Rate
5.14%
Mortgage Type
Purchase Money Mortgage
Purchase Details
Closed on
May 8, 2006
Sold by
Kitsap Cnty Consolidated Hsng Authority
Bought by
Clasablanca Michelle
Home Financials for this Owner
Home Financials are based on the most recent Mortgage that was taken out on this home.
Original Mortgage
$500
Interest Rate
6.46%
Mortgage Type
Stand Alone Second
Create a Home Valuation Report for This Property
The Home Valuation Report is an in-depth analysis detailing your home's value as well as a comparison with similar homes in the area
Home Values in the Area
Average Home Value in this Area
Purchase History
| Date | Buyer | Sale Price | Title Company |
|---|---|---|---|
| Shannon David A | $654 | None Available | |
| Shannon David A | -- | Land Title | |
| Clasablanca Michelle | -- | Pacific Nw Title |
Source: Public Records
Mortgage History
| Date | Status | Borrower | Loan Amount |
|---|---|---|---|
| Open | Shannon David A | $219,775 | |
| Closed | Shannon David A | $192,000 | |
| Closed | Clasablanca Michelle | $500 | |
| Closed | Clasablanca Michelle | $162,300 |
Source: Public Records
Tax History Compared to Growth
Tax History
| Year | Tax Paid | Tax Assessment Tax Assessment Total Assessment is a certain percentage of the fair market value that is determined by local assessors to be the total taxable value of land and additions on the property. | Land | Improvement |
|---|---|---|---|---|
| 2026 | $4,034 | $458,450 | $133,790 | $324,660 |
| 2025 | $4,034 | $458,450 | $133,790 | $324,660 |
| 2024 | $3,433 | $402,050 | $125,090 | $276,960 |
| 2023 | $3,491 | $402,050 | $125,090 | $276,960 |
| 2022 | $3,102 | $340,270 | $108,590 | $231,680 |
| 2021 | $3,000 | $305,010 | $97,290 | $207,720 |
| 2020 | $2,915 | $291,350 | $92,950 | $198,400 |
| 2019 | $2,732 | $273,280 | $86,870 | $186,410 |
| 2018 | $2,518 | $214,170 | $65,960 | $148,210 |
| 2017 | $2,401 | $214,170 | $65,960 | $148,210 |
| 2016 | $2,479 | $203,580 | $65,960 | $137,620 |
| 2015 | $2,401 | $198,290 | $65,960 | $132,330 |
| 2014 | -- | $159,070 | $54,970 | $104,100 |
| 2013 | -- | $159,070 | $54,970 | $104,100 |
Source: Public Records
Map
Nearby Homes
- 434 NE Ohenry Ct
- 263 NE Max William Loop
- 402 NE Inspiration St
- 31200 Washington 3
- 21032 Nordby Dr NW
- 0 xxx Big Valley Rd
- 21772 NW Monterey Loop
- 21988 Urdahl Rd NW
- 456 Little Valley Rd NE
- 0 Bond Rd NE
- 21756 Windmill Loop NW
- 21728 Urdahl Rd NW
- 22121 Jameson Ave NW
- 21555 Urdahl Rd NW
- 1430 NW Swenson Ct
- 1430 NW Swenson Ct Unit 24
- 0 NE Sawdust Hill Rd Unit NWM2446451
- 22176 Jameson Ave NW Unit 84
- 22200 Jameson Ave NW Unit 25
- 1881 Claret Loop NW
- 108 NE Max William Loop
- 78 NE Max William Loop
- 122 NE Max William Loop
- 62 NE Max William Loop
- 71 NE Max William Loop
- 134 NE Max William Loop
- 55 NE Max William Loop
- 418 NE Max William Loop
- 412 NE Max William Loop
- 85 NE Max William Loop
- 422 NE Max William Loop
- 41 NE Max William Loop
- 38 NE Max William Loop
- 408 NE Max William Loop
- 21903 Max William Place NE
- 428 NE Max William Loop
- 148 NE Max William Loop
- 25 NE Max William Loop
- 404 NE Max William Loop
- 22 NE Max William Loop