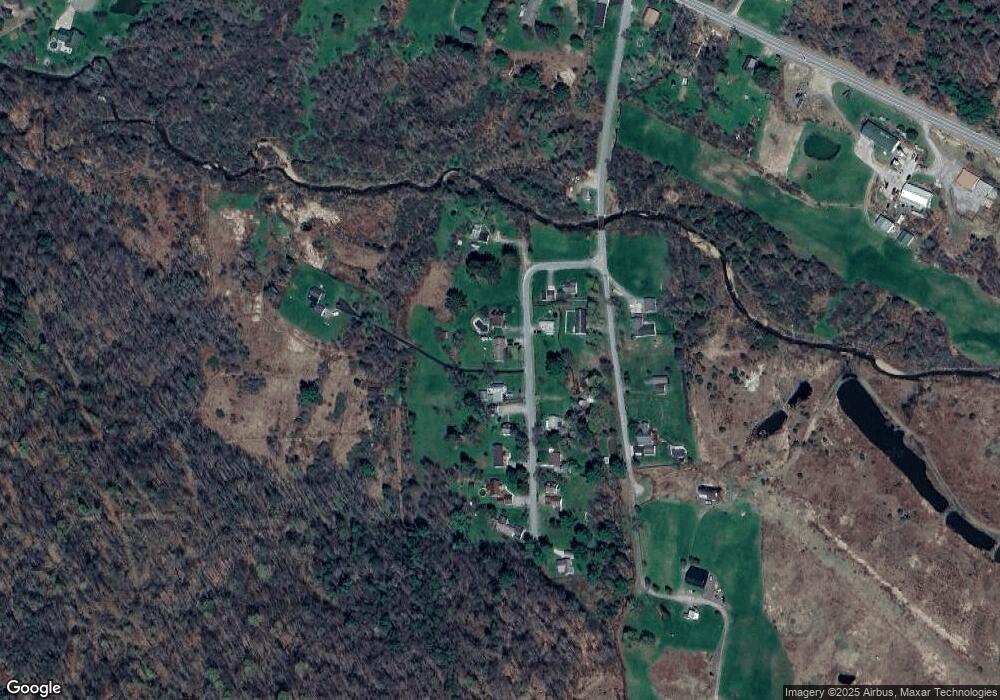
92 Pear St Bradford, PA 16701
Estimated Value: $126,512 - $183,000
--
Bed
--
Bath
960
Sq Ft
$149/Sq Ft
Est. Value
About This Home
This home is located at 92 Pear St, Bradford, PA 16701 and is currently estimated at $143,378, approximately $149 per square foot. 92 Pear St is a home located in McKean County with nearby schools including George Blaisdell Elementary School, School Street Elementary School, and Floyd C. Fretz Middle School.
Ownership History
Date
Name
Owned For
Owner Type
Purchase Details
Closed on
Dec 27, 2019
Sold by
Keck Jason C and Keck Belinda M
Bought by
Lyberg Jeremy M
Current Estimated Value
Home Financials for this Owner
Home Financials are based on the most recent Mortgage that was taken out on this home.
Original Mortgage
$68,000
Outstanding Balance
$46,614
Interest Rate
3.7%
Mortgage Type
New Conventional
Estimated Equity
$96,764
Purchase Details
Closed on
Aug 26, 2009
Sold by
Troisi Stephen A and Wright Shelley
Bought by
Keck Jason C
Home Financials for this Owner
Home Financials are based on the most recent Mortgage that was taken out on this home.
Original Mortgage
$48,800
Interest Rate
5.36%
Mortgage Type
New Conventional
Purchase Details
Closed on
Oct 29, 2008
Sold by
M & I Bank Fsb
Bought by
Troist Stephen A and Wright Shelley
Purchase Details
Closed on
Jun 25, 2008
Sold by
Caldwell Patricia A
Bought by
M & I Bank Fsb
Create a Home Valuation Report for This Property
The Home Valuation Report is an in-depth analysis detailing your home's value as well as a comparison with similar homes in the area
Home Values in the Area
Average Home Value in this Area
Purchase History
| Date | Buyer | Sale Price | Title Company |
|---|---|---|---|
| Lyberg Jeremy M | $85,000 | None Available | |
| Keck Jason C | $61,000 | None Available | |
| Troist Stephen A | $42,500 | None Available | |
| M & I Bank Fsb | $6,438 | None Available |
Source: Public Records
Mortgage History
| Date | Status | Borrower | Loan Amount |
|---|---|---|---|
| Open | Lyberg Jeremy M | $68,000 | |
| Previous Owner | Keck Jason C | $48,800 |
Source: Public Records
Tax History Compared to Growth
Tax History
| Year | Tax Paid | Tax Assessment Tax Assessment Total Assessment is a certain percentage of the fair market value that is determined by local assessors to be the total taxable value of land and additions on the property. | Land | Improvement |
|---|---|---|---|---|
| 2025 | $2,317 | $57,030 | $10,800 | $46,230 |
| 2024 | $2,245 | $57,030 | $10,800 | $46,230 |
| 2023 | $2,245 | $57,030 | $10,800 | $46,230 |
| 2022 | $2,245 | $57,030 | $10,800 | $46,230 |
| 2021 | $2,245 | $57,030 | $10,800 | $46,230 |
| 2020 | $2,188 | $57,030 | $10,800 | $46,230 |
| 2019 | $2,188 | $57,030 | $10,800 | $46,230 |
| 2018 | $21 | $57,030 | $10,800 | $46,230 |
| 2017 | -- | $57,030 | $10,800 | $46,230 |
| 2016 | $2,060 | $57,030 | $10,800 | $46,230 |
| 2015 | $727 | $57,030 | $10,800 | $46,230 |
| 2014 | $727 | $57,030 | $10,800 | $46,230 |
Source: Public Records
Map
Nearby Homes