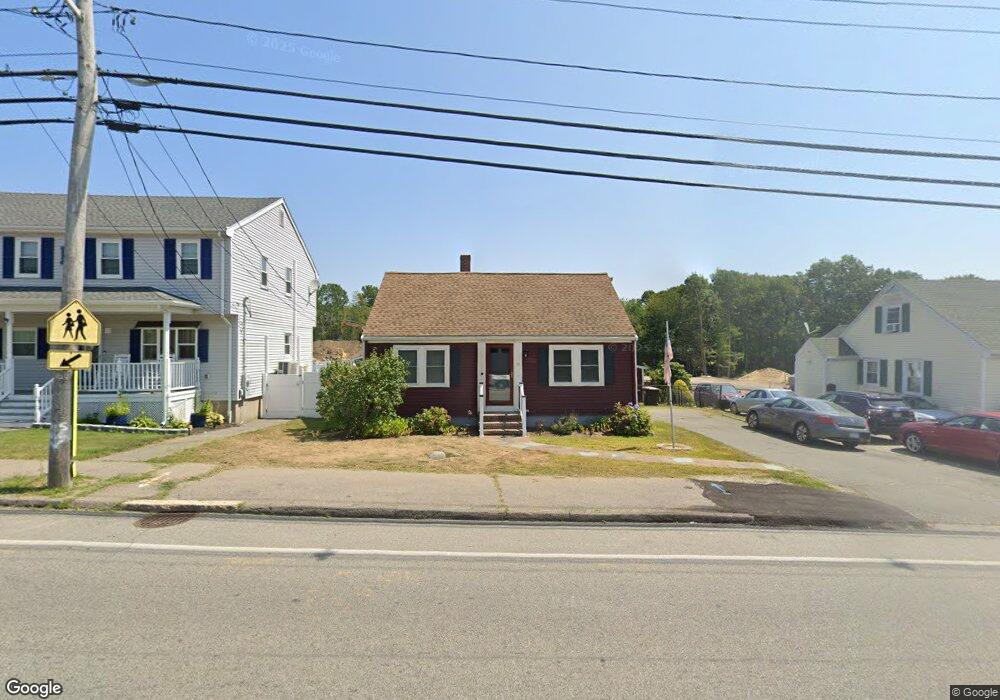
92 Quincy St Brockton, MA 02302
Estimated Value: $455,000 - $465,000
3
Beds
1
Bath
1,170
Sq Ft
$394/Sq Ft
Est. Value
About This Home
This home is located at 92 Quincy St, Brockton, MA 02302 and is currently estimated at $460,634, approximately $393 per square foot. 92 Quincy St is a home located in Plymouth County with nearby schools including Brookfield Elementary School, Mary E. Baker Elementary School, and Downey Elementary School.
Ownership History
Date
Name
Owned For
Owner Type
Purchase Details
Closed on
Mar 27, 1998
Sold by
Page John J
Bought by
Beckner Paul L and Beckner Pamela J
Current Estimated Value
Purchase Details
Closed on
Mar 17, 1995
Sold by
Department Of Housing & Urban Dev
Bought by
Page John J
Purchase Details
Closed on
Nov 16, 1994
Sold by
Mack Edward M and Cochrane Lleann J
Bought by
Department Of Housing & Urban Dev
Purchase Details
Closed on
Jan 29, 1992
Sold by
Oliveira Carlos A and Oliveira Ausenda M
Bought by
Cochrane Llean J and Mack Edward M
Create a Home Valuation Report for This Property
The Home Valuation Report is an in-depth analysis detailing your home's value as well as a comparison with similar homes in the area
Home Values in the Area
Average Home Value in this Area
Purchase History
| Date | Buyer | Sale Price | Title Company |
|---|---|---|---|
| Beckner Paul L | $93,000 | -- | |
| Page John J | $70,000 | -- | |
| Department Of Housing & Urban Dev | $114,424 | -- | |
| Cochrane Llean J | $102,000 | -- |
Source: Public Records
Mortgage History
| Date | Status | Borrower | Loan Amount |
|---|---|---|---|
| Open | Cochrane Llean J | $218,400 | |
| Closed | Cochrane Llean J | $38,000 |
Source: Public Records
Tax History Compared to Growth
Tax History
| Year | Tax Paid | Tax Assessment Tax Assessment Total Assessment is a certain percentage of the fair market value that is determined by local assessors to be the total taxable value of land and additions on the property. | Land | Improvement |
|---|---|---|---|---|
| 2025 | $4,563 | $376,800 | $143,900 | $232,900 |
| 2024 | $4,470 | $371,900 | $143,900 | $228,000 |
| 2023 | $4,656 | $358,700 | $108,500 | $250,200 |
| 2022 | $3,949 | $282,700 | $98,500 | $184,200 |
| 2021 | $3,925 | $270,700 | $90,800 | $179,900 |
| 2020 | $3,922 | $258,900 | $87,200 | $171,700 |
| 2019 | $3,514 | $226,100 | $80,500 | $145,600 |
| 2018 | $3,104 | $193,300 | $80,500 | $112,800 |
| 2017 | $2,858 | $177,500 | $80,500 | $97,000 |
| 2016 | $2,831 | $163,100 | $76,700 | $86,400 |
| 2015 | $2,617 | $144,200 | $76,700 | $67,500 |
| 2014 | $2,739 | $151,100 | $76,700 | $74,400 |
Source: Public Records
Map
Nearby Homes