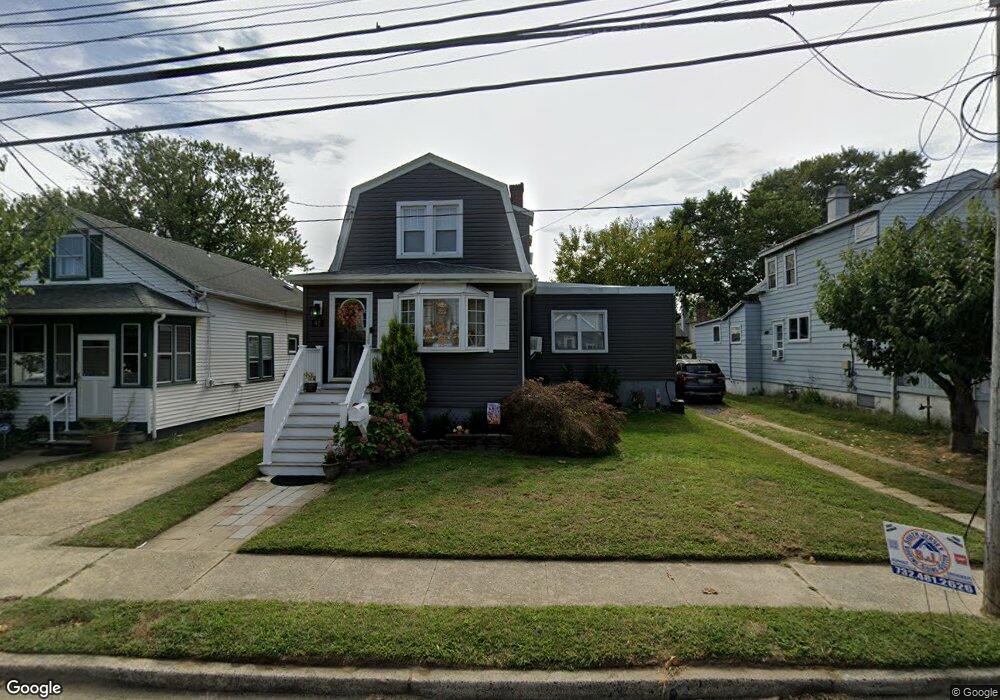
92 Seabreeze Ave North Middletown, NJ 07748
Estimated Value: $417,000 - $503,000
--
Bed
--
Bath
1,401
Sq Ft
$328/Sq Ft
Est. Value
About This Home
This home is located at 92 Seabreeze Ave, North Middletown, NJ 07748 and is currently estimated at $459,517, approximately $327 per square foot. 92 Seabreeze Ave is a home located in Monmouth County with nearby schools including Ocean Avenue Elementary School, Thorne Middle School, and Middletown High School North.
Ownership History
Date
Name
Owned For
Owner Type
Purchase Details
Closed on
Feb 28, 2003
Sold by
Lansamerica Onestop Inc
Bought by
Cousin Ryan and Cousin Tammy
Current Estimated Value
Home Financials for this Owner
Home Financials are based on the most recent Mortgage that was taken out on this home.
Original Mortgage
$179,680
Outstanding Balance
$77,244
Interest Rate
5.88%
Mortgage Type
FHA
Estimated Equity
$382,273
Purchase Details
Closed on
Feb 22, 2003
Sold by
Wigney Stuart
Bought by
Landamerica Onestop Inc
Home Financials for this Owner
Home Financials are based on the most recent Mortgage that was taken out on this home.
Original Mortgage
$179,680
Outstanding Balance
$77,244
Interest Rate
5.88%
Mortgage Type
FHA
Estimated Equity
$382,273
Purchase Details
Closed on
Apr 21, 2000
Sold by
Schmidtberg Lissa
Bought by
Wigney Stuart and Wigney Melissa
Home Financials for this Owner
Home Financials are based on the most recent Mortgage that was taken out on this home.
Original Mortgage
$127,977
Interest Rate
8.21%
Create a Home Valuation Report for This Property
The Home Valuation Report is an in-depth analysis detailing your home's value as well as a comparison with similar homes in the area
Home Values in the Area
Average Home Value in this Area
Purchase History
| Date | Buyer | Sale Price | Title Company |
|---|---|---|---|
| Cousin Ryan | $182,500 | -- | |
| Landamerica Onestop Inc | $182,500 | -- | |
| Wigney Stuart | $150,000 | -- |
Source: Public Records
Mortgage History
| Date | Status | Borrower | Loan Amount |
|---|---|---|---|
| Open | Cousin Ryan | $179,680 | |
| Previous Owner | Wigney Stuart | $127,977 |
Source: Public Records
Tax History Compared to Growth
Tax History
| Year | Tax Paid | Tax Assessment Tax Assessment Total Assessment is a certain percentage of the fair market value that is determined by local assessors to be the total taxable value of land and additions on the property. | Land | Improvement |
|---|---|---|---|---|
| 2025 | $6,865 | $443,800 | $260,000 | $183,800 |
| 2024 | $6,078 | $417,300 | $236,800 | $180,500 |
| 2023 | $6,078 | $349,700 | $187,100 | $162,600 |
| 2022 | $5,204 | $317,300 | $162,500 | $154,800 |
| 2021 | $5,204 | $250,200 | $112,500 | $137,700 |
| 2020 | $5,016 | $234,600 | $100,000 | $134,600 |
| 2019 | $4,938 | $233,800 | $100,000 | $133,800 |
| 2018 | $5,040 | $232,600 | $105,000 | $127,600 |
| 2017 | $5,216 | $238,300 | $113,000 | $125,300 |
| 2016 | $4,200 | $197,100 | $75,000 | $122,100 |
| 2015 | $4,315 | $195,500 | $75,000 | $120,500 |
| 2014 | $4,757 | $210,200 | $100,000 | $110,200 |
Source: Public Records
Map
Nearby Homes
- 98 Seabreeze Ave
- 31 Monmouth Ave
- 31 Ocean Ave
- 231 Shore Blvd
- 289 Port Monmouth Rd
- 170 Park Ave
- 12 Orchard St
- 166 Shore Blvd
- 91 Monmouth Ave
- 93 Monmouth Ave
- 151 Shore Blvd
- 71 Bay Ave
- 443 Port Monmouth Rd E
- 25 Lawrence Ave
- 32 Lakewood Ave
- 173 Forest Ave
- 83 Shore Blvd
- 74 Forest Ave
- 46 Woodland Ave
- 210 Ocean Ave
- 232 Park Ave
- 96 Seabreeze Ave
- 310 Park Ave
- 304 Park Ave
- 224 Park Ave
- 19 Monmouth Ave
- 23 Monmouth Ave
- 17 Monmouth Ave
- 98 Seabreeze Ave
- 9 Monmouth Ave
- 25 Monmouth Ave
- 222 Park Ave
- 91 Seabreeze Ave
- 95 Seabreeze Ave
- 97 Seabreeze Ave
- 311 Park Ave
- 307 Park Ave
- 5 Monmouth Ave Unit 7
- 29 Monmouth Ave
- 605 Park Ave