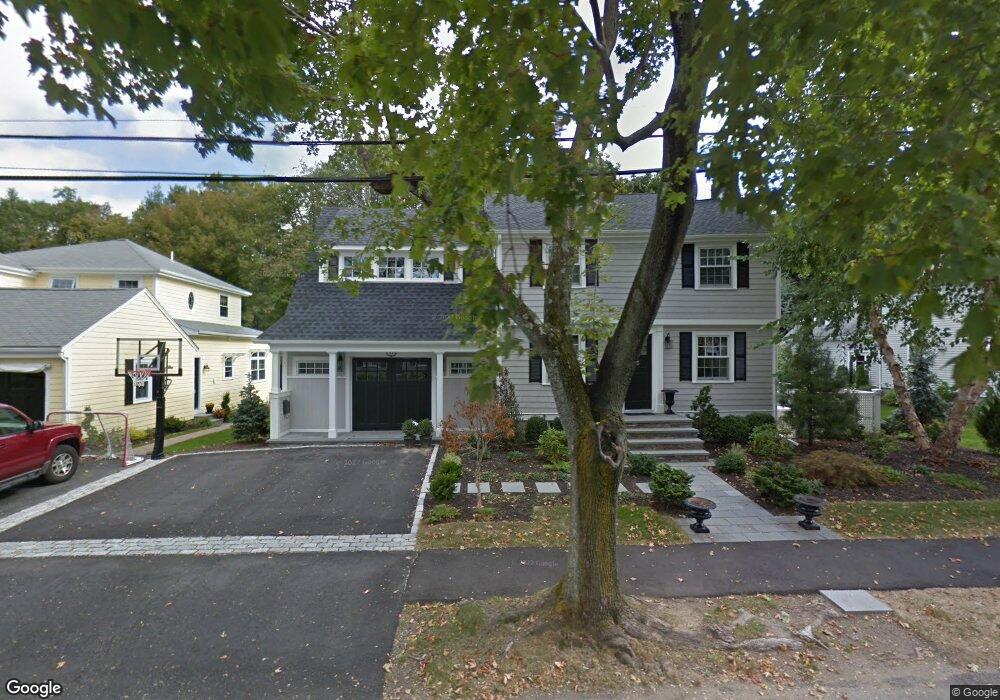
92 Sias Ln Milton, MA 02186
Milton Center NeighborhoodEstimated Value: $1,112,000 - $1,507,000
3
Beds
4
Baths
2,681
Sq Ft
$505/Sq Ft
Est. Value
About This Home
This home is located at 92 Sias Ln, Milton, MA 02186 and is currently estimated at $1,353,792, approximately $504 per square foot. 92 Sias Ln is a home located in Norfolk County with nearby schools including Milton High School, St. Mary of the Hills School, and Milton Academy.
Ownership History
Date
Name
Owned For
Owner Type
Purchase Details
Closed on
Mar 21, 2006
Sold by
Ogrady Michelle L and Ogrady Perry C
Bought by
Ogrady Michelle L
Current Estimated Value
Purchase Details
Closed on
Jul 30, 1999
Sold by
Mccallum Patricia and Mccallum Mary
Bought by
Ogrady Perry C and Ogrady Michelle L
Home Financials for this Owner
Home Financials are based on the most recent Mortgage that was taken out on this home.
Original Mortgage
$225,500
Interest Rate
7.61%
Mortgage Type
Purchase Money Mortgage
Create a Home Valuation Report for This Property
The Home Valuation Report is an in-depth analysis detailing your home's value as well as a comparison with similar homes in the area
Home Values in the Area
Average Home Value in this Area
Purchase History
| Date | Buyer | Sale Price | Title Company |
|---|---|---|---|
| Ogrady Michelle L | -- | -- | |
| Ogrady Perry C | $340,500 | -- |
Source: Public Records
Mortgage History
| Date | Status | Borrower | Loan Amount |
|---|---|---|---|
| Previous Owner | Ogrady Perry C | $225,500 | |
| Previous Owner | Ogrady Perry C | $105,000 | |
| Previous Owner | Ogrady Perry C | $107,000 |
Source: Public Records
Tax History
| Year | Tax Paid | Tax Assessment Tax Assessment Total Assessment is a certain percentage of the fair market value that is determined by local assessors to be the total taxable value of land and additions on the property. | Land | Improvement |
|---|---|---|---|---|
| 2025 | $13,574 | $1,224,000 | $565,900 | $658,100 |
| 2024 | $13,274 | $1,215,600 | $539,100 | $676,500 |
| 2023 | $13,166 | $1,154,900 | $513,400 | $641,500 |
| 2022 | $12,623 | $1,012,300 | $513,400 | $498,900 |
| 2021 | $12,190 | $928,400 | $453,200 | $475,200 |
| 2020 | $11,407 | $869,400 | $404,000 | $465,400 |
| 2019 | $11,125 | $844,100 | $392,200 | $451,900 |
| 2018 | $10,973 | $794,600 | $351,600 | $443,000 |
| 2017 | $10,268 | $757,200 | $334,900 | $422,300 |
| 2016 | $10,473 | $775,800 | $362,800 | $413,000 |
| 2015 | $9,934 | $712,600 | $312,600 | $400,000 |
Source: Public Records
Map
Nearby Homes
- 67 Frothingham St
- 403405 Reedsdale Rd
- 36 Fairbanks Rd
- 97 Pleasant St
- 111-113 Pleasant St
- 260 Canton Ave
- 484 Brook Rd
- 207 Pleasant St
- 424 Brook Rd
- 213 School St
- 40 Dean Rd
- 46 Audubon Rd
- 259 Central Ave
- 341 Highland St
- 7 Russell St
- 10 Brookside Park
- 30 Ridge Rd
- 7 Parkway Crescent
- 85 Forbes Rd
- 214 Brook Rd
Your Personal Tour Guide
Ask me questions while you tour the home.