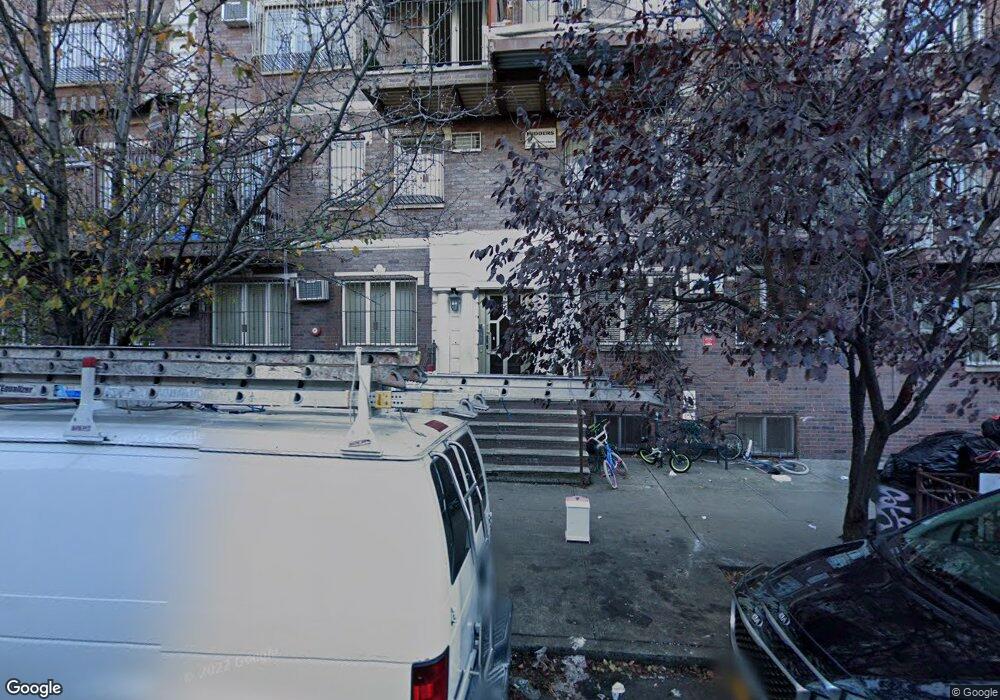
92 Spencer St Unit 4L Brooklyn, NY 11205
Bed-Stuy NeighborhoodEstimated Value: $776,000 - $1,203,000
--
Bed
--
Bath
1,247
Sq Ft
$732/Sq Ft
Est. Value
About This Home
This home is located at 92 Spencer St Unit 4L, Brooklyn, NY 11205 and is currently estimated at $912,184, approximately $731 per square foot. 92 Spencer St Unit 4L is a home located in Kings County with nearby schools including P.S. 54 - Samuel C. Barnes, Bnos Square of Williamsburg, and Mosdos Krula.
Ownership History
Date
Name
Owned For
Owner Type
Purchase Details
Closed on
Feb 7, 2018
Sold by
Stein Joel
Bought by
Rosenberg Yoel
Current Estimated Value
Home Financials for this Owner
Home Financials are based on the most recent Mortgage that was taken out on this home.
Original Mortgage
$330,000
Outstanding Balance
$279,199
Interest Rate
3.95%
Mortgage Type
New Conventional
Estimated Equity
$632,985
Purchase Details
Closed on
Aug 28, 2008
Sold by
Roth Samuel and Stein Joel
Bought by
Stein Joel
Purchase Details
Closed on
Apr 15, 2006
Sold by
Stein Joel
Bought by
Roth Samuel and Stein Joel
Purchase Details
Closed on
Dec 28, 2005
Sold by
Concord Park Realty Llc
Bought by
Stein Joel
Home Financials for this Owner
Home Financials are based on the most recent Mortgage that was taken out on this home.
Original Mortgage
$217,500
Interest Rate
6.28%
Mortgage Type
Purchase Money Mortgage
Create a Home Valuation Report for This Property
The Home Valuation Report is an in-depth analysis detailing your home's value as well as a comparison with similar homes in the area
Home Values in the Area
Average Home Value in this Area
Purchase History
| Date | Buyer | Sale Price | Title Company |
|---|---|---|---|
| Rosenberg Yoel | $490,000 | -- | |
| Rosenberg Yoel | $490,000 | -- | |
| Stein Joel | -- | -- | |
| Stein Joel | -- | -- | |
| Roth Samuel | -- | -- | |
| Roth Samuel | -- | -- | |
| Stein Joel | $294,060 | -- | |
| Stein Joel | $294,060 | -- |
Source: Public Records
Mortgage History
| Date | Status | Borrower | Loan Amount |
|---|---|---|---|
| Open | Rosenberg Yoel | $330,000 | |
| Closed | Rosenberg Yoel | $330,000 | |
| Previous Owner | Stein Joel | $217,500 | |
| Closed | Stein Joel | $0 |
Source: Public Records
Tax History Compared to Growth
Tax History
| Year | Tax Paid | Tax Assessment Tax Assessment Total Assessment is a certain percentage of the fair market value that is determined by local assessors to be the total taxable value of land and additions on the property. | Land | Improvement |
|---|---|---|---|---|
| 2025 | $338 | $83,959 | $3,785 | $80,174 |
| 2024 | $338 | $80,246 | $3,785 | $76,461 |
| 2023 | $332 | $69,863 | $3,785 | $66,078 |
| 2022 | $331 | $57,246 | $3,785 | $53,461 |
| 2021 | $332 | $55,444 | $3,785 | $51,659 |
| 2020 | $163 | $62,906 | $3,785 | $59,121 |
| 2019 | $341 | $57,319 | $3,785 | $53,534 |
| 2018 | $344 | $54,904 | $3,786 | $51,118 |
| 2017 | $344 | $45,639 | $3,785 | $41,854 |
| 2016 | $349 | $43,476 | $3,786 | $39,690 |
| 2015 | $272 | $42,178 | $3,785 | $38,393 |
| 2014 | $272 | $31,579 | $3,785 | $27,794 |
Source: Public Records
Map
Nearby Homes
- 689 Myrtle Ave Unit 2E
- 102 Walworth St
- 609 Myrtle Ave Unit 2A
- 192 Spencer St Unit 3A
- 192 Spencer St Unit 1E
- 192 Spencer St Unit 1-D
- 192 Spencer St Unit 4-E
- 764 Kent Ave Unit 2
- 195 Spencer St Unit 7B
- 197 Spencer St Unit 3B
- 274 Wallabout St Unit 7B
- 90 Heyward St
- 68A Middleton St
- 218 Classon Ave Unit GARDEN
- 34 Hart St
- 104 Stockton St Unit 6
- 27 Pulaski St
- 244 Franklin Ave Unit 5B
- 859 Myrtle Ave Unit 8G
- 57 Lorimer St Unit 1A
- 92 Spencer St Unit 6L
- 92 Spencer St Unit 5L
- 92 Spencer St Unit 3L
- 92 Spencer St Unit 2L
- 92 Spencer St Unit 1L
- 90 Spencer St Unit 6R
- 90 Spencer St Unit 5R
- 90 Spencer St Unit 4R
- 90 Spencer St Unit 3R
- 90 Spencer St Unit 2R
- 90 Spencer St Unit 1R
- 90 Spencer St
- 88 Spencer St Unit 6L
- 88 Spencer St Unit 5L
- 88 Spencer St Unit 4L
- 88 Spencer St Unit 3L
- 88 Spencer St Unit 2L
- 88 Spencer St Unit 1L
- 94 Spencer St Unit 6
- 94 Spencer St Unit 5