92 W 35th St Holland, MI 49423
Maplewood NeighborhoodEstimated Value: $252,000 - $329,000
3
Beds
2
Baths
1,233
Sq Ft
$239/Sq Ft
Est. Value
About This Home
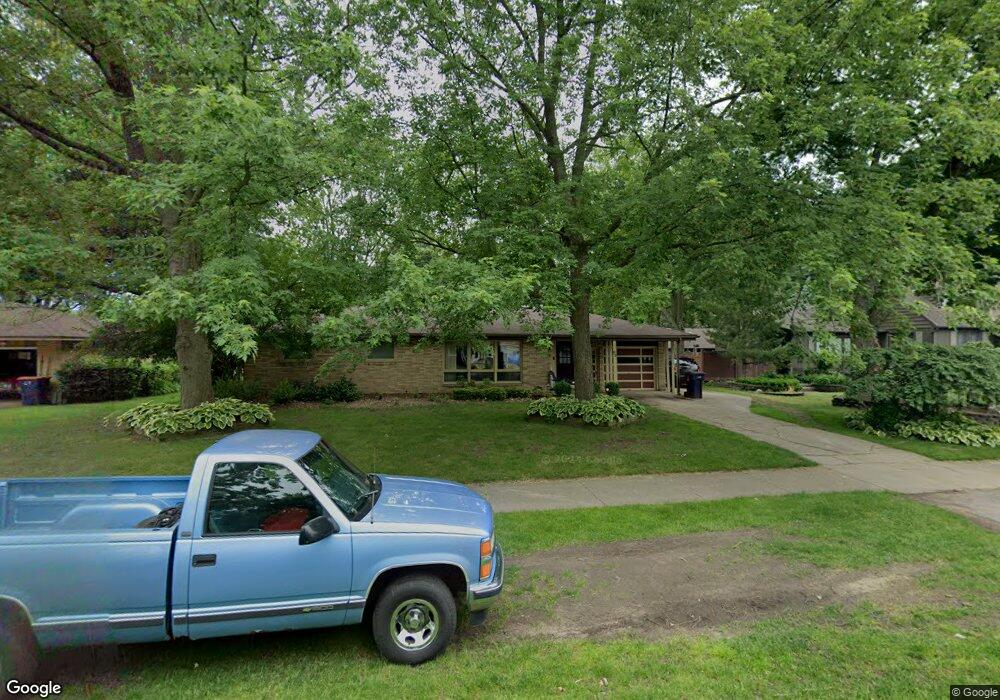
This home is located at 92 W 35th St, Holland, MI 49423 and is currently estimated at $294,497, approximately $238 per square foot. 92 W 35th St is a home located in Allegan County with nearby schools including Jefferson Elementary School, Holland High School, and Black River Public School Elementary.
Ownership History
Date
Name
Owned For
Owner Type
Purchase Details
Closed on
May 13, 2025
Sold by
Oosting Keith and Oosting Bryan
Bought by
Oosting Brothers Properties Llc
Current Estimated Value
Purchase Details
Closed on
May 6, 2025
Sold by
Donald And Marilyn Oosting Trust and Oosting Kirk Allyn
Bought by
Oosting Keith and Oosting Bryan
Purchase Details
Closed on
Apr 12, 2016
Sold by
Oosting Donald Wayne and Oosting Marilyn Ruth
Bought by
Oosting Donald Wayne and Oosting Marilyn Ruth
Purchase Details
Closed on
Jul 13, 2000
Sold by
Oosting Donald
Bought by
Oosting Donald Wayne and Marilyn Ruth
Create a Home Valuation Report for This Property
The Home Valuation Report is an in-depth analysis detailing your home's value as well as a comparison with similar homes in the area
Home Values in the Area
Average Home Value in this Area
Purchase History
| Date | Buyer | Sale Price | Title Company |
|---|---|---|---|
| Oosting Brothers Properties Llc | -- | None Listed On Document | |
| Oosting Brothers Properties Llc | -- | None Listed On Document | |
| Oosting Keith | $250,000 | Chicago Title | |
| Oosting Donald Wayne | -- | Attorney | |
| Oosting Donald Wayne | -- | -- |
Source: Public Records
Tax History Compared to Growth
Tax History
| Year | Tax Paid | Tax Assessment Tax Assessment Total Assessment is a certain percentage of the fair market value that is determined by local assessors to be the total taxable value of land and additions on the property. | Land | Improvement |
|---|---|---|---|---|
| 2025 | $3,912 | $152,800 | $42,100 | $110,700 |
| 2024 | -- | $126,900 | $37,100 | $89,800 |
| 2023 | $3,662 | $113,000 | $30,900 | $82,100 |
| 2022 | $3,494 | $103,700 | $29,700 | $74,000 |
| 2021 | $3,490 | $97,900 | $28,500 | $69,400 |
| 2020 | $3,333 | $83,800 | $83,800 | $0 |
| 2019 | $2,231 | $72,200 | $17,800 | $54,400 |
| 2018 | $2,231 | $71,600 | $17,800 | $53,800 |
| 2017 | $0 | $59,800 | $8,600 | $51,200 |
| 2016 | $0 | $59,800 | $8,600 | $51,200 |
| 2015 | -- | $59,800 | $8,600 | $51,200 |
| 2014 | -- | $51,900 | $8,600 | $43,300 |
| 2013 | -- | $48,900 | $8,600 | $40,300 |
Source: Public Records
Map
Nearby Homes
- 91 W 40th St
- 817 Central Ave
- 149 W 32nd St
- 135 W 31st St
- 155 W 31st St
- 81 E 40th St
- 834 Millbridge Ave Unit 56
- 106 E 31st St
- 94 Old Mill Dr Unit 16
- 860 York Ave
- 171 E 37th St
- 199 E 34th St Unit 10
- 202 E 34th St
- 13 W 26th St
- 253 W 28th St
- 1112 Fountain View Cir
- 935 Chelsea Ct
- 648 Columbia Ave
- 1084 Fountain View Cir Unit 4
- 333 W 28th St