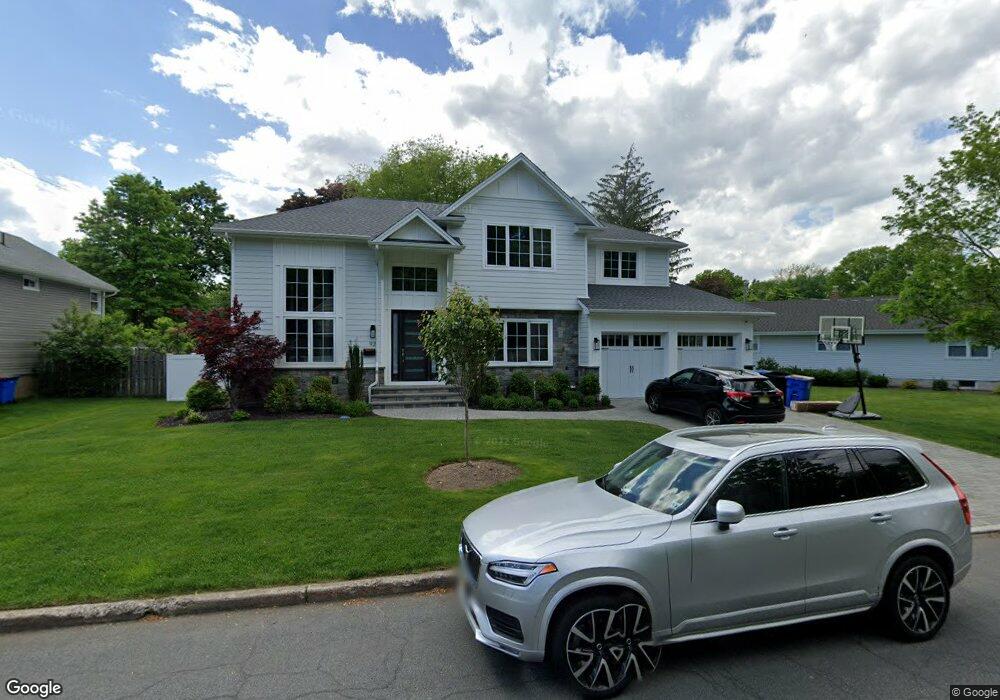
92 Walnut Dr Tenafly, NJ 07670
Estimated Value: $2,181,000 - $2,370,184
6
Beds
5
Baths
3,292
Sq Ft
$690/Sq Ft
Est. Value
About This Home
This home is located at 92 Walnut Dr, Tenafly, NJ 07670 and is currently estimated at $2,271,296, approximately $689 per square foot. 92 Walnut Dr is a home located in Bergen County with nearby schools including Tenafly Middle School, Tenafly High School, and Englewood on the Palisades Charter School.
Ownership History
Date
Name
Owned For
Owner Type
Purchase Details
Closed on
Apr 30, 2020
Sold by
Giesi Holland Llc
Bought by
Sarkar Debkumar and Kumar Neelja Daisy
Current Estimated Value
Home Financials for this Owner
Home Financials are based on the most recent Mortgage that was taken out on this home.
Original Mortgage
$1,350,000
Outstanding Balance
$1,185,753
Interest Rate
3.3%
Mortgage Type
New Conventional
Estimated Equity
$1,085,543
Purchase Details
Closed on
May 16, 2018
Sold by
Kalt Mark and Kalt Amy
Bought by
Giesi Holland Llc
Purchase Details
Closed on
Mar 10, 1995
Sold by
Yaldizian Lorraine
Bought by
Kalt Mark and Kalt Amy
Home Financials for this Owner
Home Financials are based on the most recent Mortgage that was taken out on this home.
Original Mortgage
$183,000
Interest Rate
8.78%
Create a Home Valuation Report for This Property
The Home Valuation Report is an in-depth analysis detailing your home's value as well as a comparison with similar homes in the area
Home Values in the Area
Average Home Value in this Area
Purchase History
| Date | Buyer | Sale Price | Title Company |
|---|---|---|---|
| Sarkar Debkumar | $1,500,000 | Acres Land Title Agency Llc | |
| Giesi Holland Llc | $630,000 | -- | |
| Kalt Mark | $282,500 | -- |
Source: Public Records
Mortgage History
| Date | Status | Borrower | Loan Amount |
|---|---|---|---|
| Open | Sarkar Debkumar | $1,350,000 | |
| Previous Owner | Kalt Mark | $183,000 |
Source: Public Records
Tax History
| Year | Tax Paid | Tax Assessment Tax Assessment Total Assessment is a certain percentage of the fair market value that is determined by local assessors to be the total taxable value of land and additions on the property. | Land | Improvement |
|---|---|---|---|---|
| 2025 | $34,498 | $1,214,300 | $344,600 | $869,700 |
| 2024 | $33,660 | $1,214,300 | $344,600 | $869,700 |
| 2023 | $32,847 | $1,214,300 | $344,600 | $869,700 |
| 2022 | $32,847 | $1,214,300 | $344,600 | $869,700 |
| 2021 | $32,264 | $1,214,300 | $344,600 | $869,700 |
| 2020 | $9,022 | $344,600 | $344,600 | $0 |
| 2019 | $8,863 | $344,600 | $344,600 | $0 |
| 2018 | $12,673 | $500,500 | $344,600 | $155,900 |
| 2017 | $12,628 | $500,500 | $344,600 | $155,900 |
| 2016 | $12,377 | $500,500 | $344,600 | $155,900 |
| 2015 | $12,102 | $500,500 | $344,600 | $155,900 |
| 2014 | $11,877 | $500,500 | $344,600 | $155,900 |
Source: Public Records
Map
Nearby Homes
- 494 Orchard St
- 63 W Hudson Ave Unit C5
- 54 Windsor Rd
- 12 Westervelt Ave
- 171 Pleasant Ave
- 54 Westervelt Ave Unit B
- 401 Conrad Rd
- 69 Sussex Rd
- 142 Saint Nicholas Ave
- 203 Cambridge Ave
- 82 S Roosevelt Square
- 246 Cambridge Ave
- 27 Suffolk Ln
- 468 Lydecker St
- 260 Pindle Ave
- 61 Glenwood Rd
- 15 W Hamilton Ave
- 275 Engle St Unit J4
- 142 Slocum Ave
- 76 Forest Rd
- 98 Walnut Dr
- 80 Walnut Dr
- 46 Evergreen Place
- 40 Evergreen Place
- 78 Walnut Dr
- 34 Evergreen Place
- 89 Walnut Dr
- 95 Walnut Dr
- 104 Walnut Dr
- 101 Walnut Dr
- 83 Walnut Dr
- 28 Evergreen Place
- 107 Walnut Dr
- 110 Walnut Dr
- 49 Evergreen Place
- 39 Evergreen Place
- 57 Evergreen Place
- 22 Evergreen Place
- 67 Walnut Dr
- 33 Evergreen Place
Your Personal Tour Guide
Ask me questions while you tour the home.