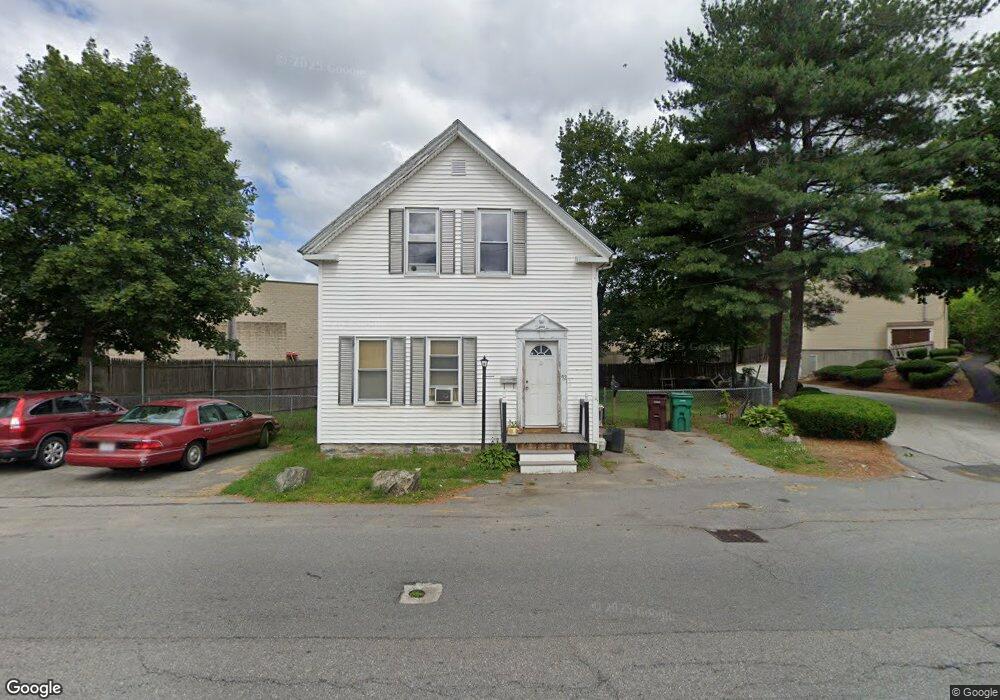
92 Willard St Lowell, MA 01850
Centralville NeighborhoodEstimated Value: $474,150 - $635,000
4
Beds
2
Baths
2,000
Sq Ft
$271/Sq Ft
Est. Value
About This Home
This home is located at 92 Willard St, Lowell, MA 01850 and is currently estimated at $542,038, approximately $271 per square foot. 92 Willard St is a home located in Middlesex County with nearby schools including S. Christa McAuliffe Elementary School, Greenhalge Elementary School, and Moody Elementary School.
Ownership History
Date
Name
Owned For
Owner Type
Purchase Details
Closed on
Sep 16, 2022
Sold by
Bernier Laura M
Bought by
Laura M Bernier Lt and Bernier
Current Estimated Value
Purchase Details
Closed on
Aug 31, 2001
Sold by
Bourgeois Normand A and Bourgeois Albert M
Bought by
Bernier Laurie
Home Financials for this Owner
Home Financials are based on the most recent Mortgage that was taken out on this home.
Original Mortgage
$140,000
Interest Rate
7.06%
Mortgage Type
Purchase Money Mortgage
Purchase Details
Closed on
Jan 27, 1989
Sold by
Mccarthy Robert
Bought by
Bourgeois Norman
Home Financials for this Owner
Home Financials are based on the most recent Mortgage that was taken out on this home.
Original Mortgage
$108,800
Interest Rate
10.66%
Mortgage Type
Purchase Money Mortgage
Create a Home Valuation Report for This Property
The Home Valuation Report is an in-depth analysis detailing your home's value as well as a comparison with similar homes in the area
Home Values in the Area
Average Home Value in this Area
Purchase History
| Date | Buyer | Sale Price | Title Company |
|---|---|---|---|
| Laura M Bernier Lt | -- | None Available | |
| Laura M Bernier Lt | -- | None Available | |
| Bernier Laurie | $170,000 | -- | |
| Bernier Laurie | $170,000 | -- | |
| Bourgeois Norman | $136,000 | -- | |
| Bourgeois Norman | $136,000 | -- |
Source: Public Records
Mortgage History
| Date | Status | Borrower | Loan Amount |
|---|---|---|---|
| Previous Owner | Bourgeois Norman | $140,000 | |
| Previous Owner | Bourgeois Norman | $104,400 | |
| Previous Owner | Bourgeois Norman | $108,800 |
Source: Public Records
Tax History
| Year | Tax Paid | Tax Assessment Tax Assessment Total Assessment is a certain percentage of the fair market value that is determined by local assessors to be the total taxable value of land and additions on the property. | Land | Improvement |
|---|---|---|---|---|
| 2025 | $4,835 | $421,200 | $134,500 | $286,700 |
| 2024 | $4,516 | $379,200 | $125,700 | $253,500 |
| 2023 | $4,189 | $337,300 | $109,300 | $228,000 |
| 2022 | $3,879 | $305,700 | $99,400 | $206,300 |
| 2021 | $3,597 | $267,200 | $86,400 | $180,800 |
| 2020 | $3,237 | $242,300 | $75,500 | $166,800 |
| 2019 | $3,134 | $223,200 | $69,900 | $153,300 |
| 2018 | $2,864 | $199,000 | $66,600 | $132,400 |
| 2017 | $2,706 | $181,400 | $60,500 | $120,900 |
| 2016 | $2,818 | $185,900 | $59,000 | $126,900 |
| 2015 | $2,629 | $169,800 | $59,000 | $110,800 |
| 2013 | $2,453 | $163,400 | $69,000 | $94,400 |
Source: Public Records
Map
Nearby Homes
- 175 Willard St Unit 9
- 40 Arlington Ave
- 700 Robbins Ave Unit 6
- 23 18th St
- 668 Robbins Ave Unit 1
- 35 Whitney Ave Unit 33
- 69 Arlington St
- 1391 Bridge St
- 345 Hildreth St Unit 14
- 367 Hildreth St Unit 14
- 54 Montaup Ave
- 417 Hildreth St Unit 30
- 4 Hazelwood Ave Unit 12
- 15 Dana St
- 144 Thissell Ave Unit 11
- 18 May St
- 10 Lanseigne St
- 551 Hildreth St Unit 10
- 106 Methuen St Unit B
- 26 Farmland Rd Unit C
- . Willard St
- 697 Beacon St
- 131 Willard St
- 686 Beacon St
- 682 Beacon St
- 141 Willard St
- 684 Beacon St
- 126 Willard St Street J
- 99 Willard St
- 126 Willard St Unit N
- 126 Willard St Unit M
- 126 Willard St Unit L
- 126 Willard St Unit I
- 126 Willard St Unit A
- 126 Willard St Unit B
- 126 Willard St Unit G
- 126 Willard St Unit C
- 126 Willard St Unit H
- 126 Willard St Unit O
- 126 Willard St Unit J
Your Personal Tour Guide
Ask me questions while you tour the home.