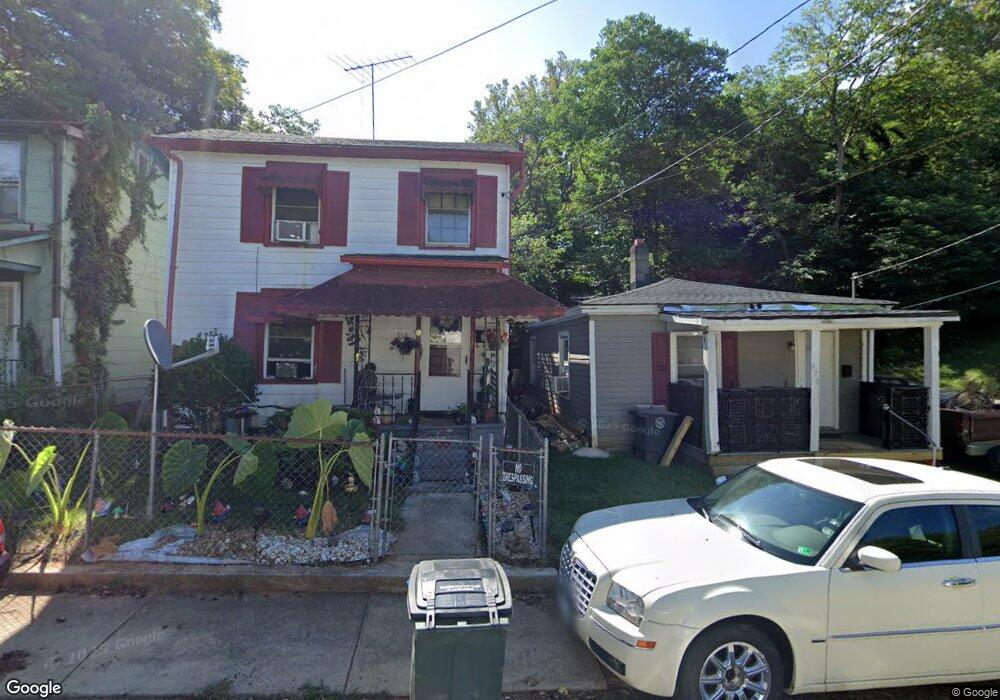
920 2nd St Lynchburg, VA 24504
Tinbridge Hill NeighborhoodEstimated Value: $50,000 - $86,000
--
Bed
1
Bath
646
Sq Ft
$100/Sq Ft
Est. Value
About This Home
This home is located at 920 2nd St, Lynchburg, VA 24504 and is currently estimated at $64,908, approximately $100 per square foot. 920 2nd St is a home located in Lynchburg City with nearby schools including Bedford Hills Elementary School, Linkhorne Middle School, and E.C. Glass High School.
Ownership History
Date
Name
Owned For
Owner Type
Purchase Details
Closed on
May 18, 2021
Sold by
Lynchburg Rental Properties Llc
Bought by
Powell Property Network Inc
Current Estimated Value
Purchase Details
Closed on
Aug 31, 2020
Sold by
Streamline Llc
Bought by
Lynchburg Rental Properties Llc
Home Financials for this Owner
Home Financials are based on the most recent Mortgage that was taken out on this home.
Original Mortgage
$28,000
Interest Rate
2.9%
Mortgage Type
Commercial
Purchase Details
Closed on
Jan 30, 2020
Sold by
Smith Essie C
Bought by
Streamline Llc
Create a Home Valuation Report for This Property
The Home Valuation Report is an in-depth analysis detailing your home's value as well as a comparison with similar homes in the area
Home Values in the Area
Average Home Value in this Area
Purchase History
| Date | Buyer | Sale Price | Title Company |
|---|---|---|---|
| Powell Property Network Inc | $35,000 | Advantage Title | |
| Lynchburg Rental Properties Llc | $35,000 | Chicago Title | |
| Streamline Llc | $7,000 | None Available |
Source: Public Records
Mortgage History
| Date | Status | Borrower | Loan Amount |
|---|---|---|---|
| Previous Owner | Lynchburg Rental Properties Llc | $28,000 |
Source: Public Records
Tax History Compared to Growth
Tax History
| Year | Tax Paid | Tax Assessment Tax Assessment Total Assessment is a certain percentage of the fair market value that is determined by local assessors to be the total taxable value of land and additions on the property. | Land | Improvement |
|---|---|---|---|---|
| 2025 | $360 | $42,900 | $15,000 | $27,900 |
| 2024 | $331 | $37,200 | $12,000 | $25,200 |
| 2023 | $331 | $37,200 | $12,000 | $25,200 |
| 2022 | $382 | $37,100 | $10,000 | $27,100 |
| 2021 | $412 | $37,100 | $10,000 | $27,100 |
| 2020 | $172 | $15,500 | $6,000 | $9,500 |
| 2019 | $172 | $15,500 | $6,000 | $9,500 |
| 2018 | $196 | $17,700 | $3,000 | $14,700 |
| 2017 | $196 | $17,700 | $3,000 | $14,700 |
| 2016 | $196 | $17,700 | $3,000 | $14,700 |
| 2015 | $196 | $19,300 | $1,000 | $18,300 |
| 2014 | $214 | $19,300 | $1,000 | $18,300 |
Source: Public Records
Map
Nearby Homes