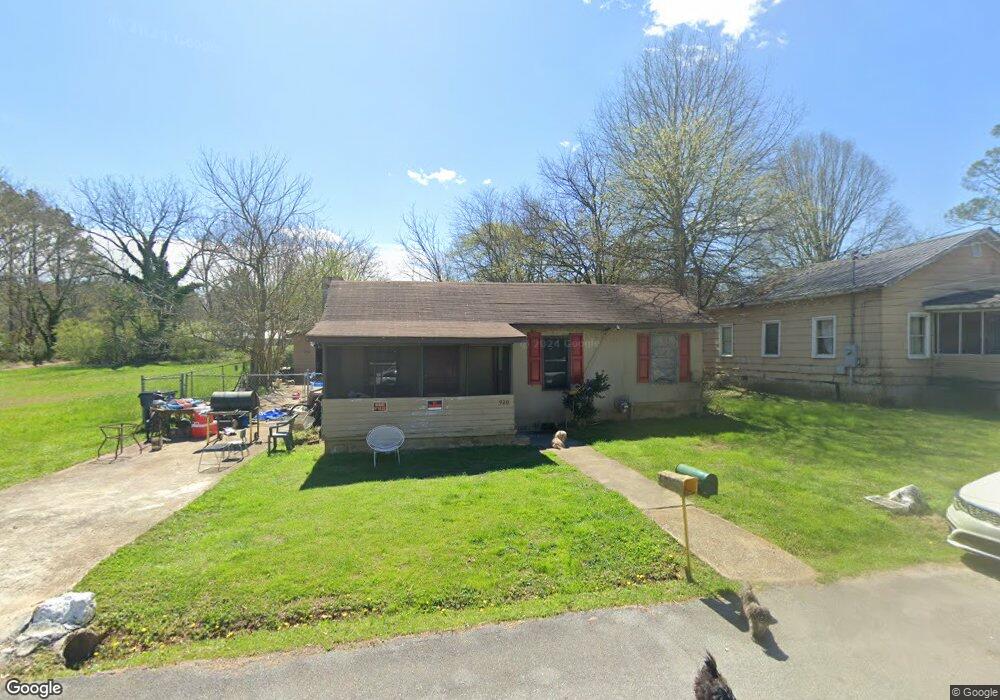
920 Davenport St Cedartown, GA 30125
Estimated Value: $98,000 - $133,000
2
Beds
1
Bath
1,040
Sq Ft
$109/Sq Ft
Est. Value
About This Home
This home is located at 920 Davenport St, Cedartown, GA 30125 and is currently estimated at $113,549, approximately $109 per square foot. 920 Davenport St is a home located in Polk County with nearby schools including Cedar Christian School.
Ownership History
Date
Name
Owned For
Owner Type
Purchase Details
Closed on
Apr 20, 2021
Sold by
Desantis Tamara
Bought by
Murphy Apollonia Elaine and Murphy Andrew
Current Estimated Value
Purchase Details
Closed on
Jul 21, 2006
Sold by
Equity One Inc
Bought by
Desantis Tamara
Purchase Details
Closed on
Jan 4, 2005
Sold by
Equity One Inc
Bought by
Equity One Inc
Purchase Details
Closed on
Apr 23, 1997
Sold by
Jackson Arvella
Bought by
Atkins Arvella Jackson
Purchase Details
Closed on
Jan 1, 1963
Sold by
Jackson Robert
Bought by
Jackson Arvella
Purchase Details
Closed on
Jan 1, 1901
Bought by
Jackson Robert
Create a Home Valuation Report for This Property
The Home Valuation Report is an in-depth analysis detailing your home's value as well as a comparison with similar homes in the area
Home Values in the Area
Average Home Value in this Area
Purchase History
| Date | Buyer | Sale Price | Title Company |
|---|---|---|---|
| Murphy Apollonia Elaine | $20,000 | -- | |
| Desantis Tamara | $20,400 | -- | |
| Equity One Inc | $70,611 | -- | |
| Atkins Arvella Jackson | -- | -- | |
| Jackson Arvella | -- | -- | |
| Jackson Robert | -- | -- |
Source: Public Records
Tax History Compared to Growth
Tax History
| Year | Tax Paid | Tax Assessment Tax Assessment Total Assessment is a certain percentage of the fair market value that is determined by local assessors to be the total taxable value of land and additions on the property. | Land | Improvement |
|---|---|---|---|---|
| 2024 | $743 | $23,520 | $4,800 | $18,720 |
| 2023 | $508 | $14,664 | $550 | $14,114 |
| 2022 | $190 | $13,502 | $550 | $12,952 |
| 2021 | $325 | $13,502 | $550 | $12,952 |
| 2020 | $325 | $13,502 | $550 | $12,952 |
| 2019 | $224 | $8,338 | $1,511 | $6,827 |
| 2018 | $219 | $7,950 | $1,295 | $6,655 |
| 2017 | $216 | $7,950 | $1,295 | $6,655 |
| 2016 | $216 | $7,950 | $1,295 | $6,655 |
| 2015 | $150 | $5,482 | $1,295 | $4,187 |
| 2014 | $151 | $5,482 | $1,295 | $4,187 |
Source: Public Records
Map
Nearby Homes