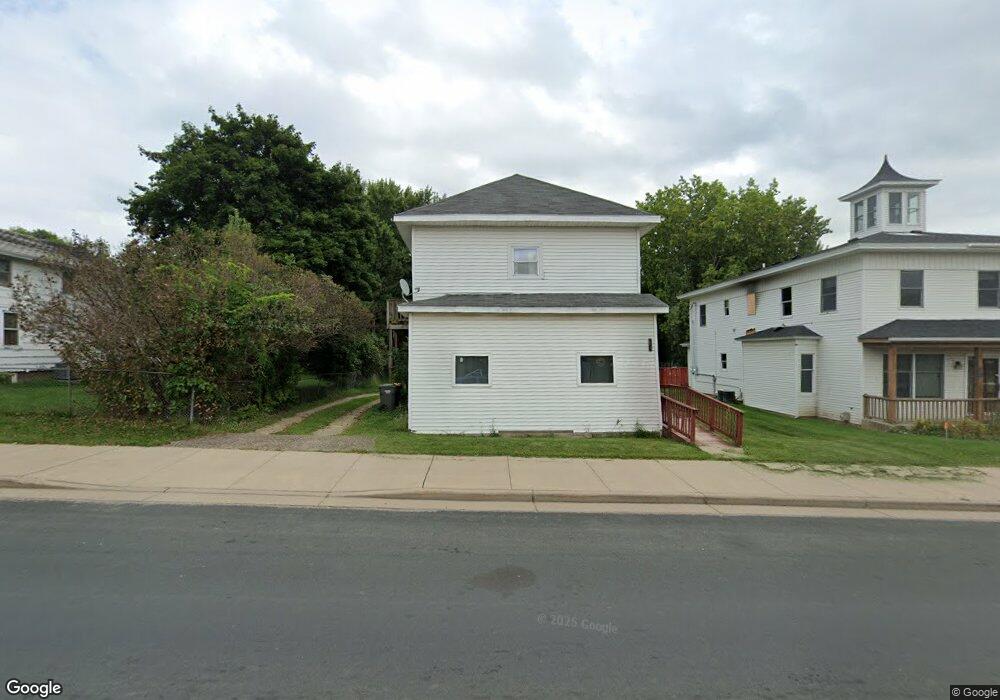
920 Davis St Hammond, WI 54015
Estimated Value: $116,470
1
Bed
--
Bath
900
Sq Ft
$129/Sq Ft
Est. Value
About This Home
This home is located at 920 Davis St, Hammond, WI 54015 and is currently estimated at $116,470, approximately $129 per square foot. 920 Davis St is a home located in St. Croix County with nearby schools including Saint Croix Central Elementary School, Saint Croix Central Middle School, and St. Croix Central High School.
Ownership History
Date
Name
Owned For
Owner Type
Purchase Details
Closed on
Nov 18, 2015
Sold by
Fall Matthew
Bought by
Cavilon Properties Lc
Current Estimated Value
Home Financials for this Owner
Home Financials are based on the most recent Mortgage that was taken out on this home.
Original Mortgage
$58,800
Outstanding Balance
$46,233
Interest Rate
3.78%
Mortgage Type
Purchase Money Mortgage
Estimated Equity
$70,237
Purchase Details
Closed on
Aug 30, 2013
Sold by
Fall Douglas C
Bought by
Fall Matthew
Purchase Details
Closed on
Sep 3, 2010
Sold by
Bird Shaun
Bought by
Fall Matthew and Fall Douglas C
Home Financials for this Owner
Home Financials are based on the most recent Mortgage that was taken out on this home.
Original Mortgage
$49,900
Interest Rate
6%
Mortgage Type
Seller Take Back
Purchase Details
Closed on
Apr 29, 2008
Sold by
Guski Timothy J and Guski Angela R
Bought by
Bird Shaun
Create a Home Valuation Report for This Property
The Home Valuation Report is an in-depth analysis detailing your home's value as well as a comparison with similar homes in the area
Home Values in the Area
Average Home Value in this Area
Purchase History
| Date | Buyer | Sale Price | Title Company |
|---|---|---|---|
| Cavilon Properties Lc | -- | Attorney | |
| Fall Matthew | -- | Attorney | |
| Fall Matthew | -- | None Available | |
| Fall Matthew | $59,900 | None Available | |
| Bird Shaun | $60,000 | None Available |
Source: Public Records
Mortgage History
| Date | Status | Borrower | Loan Amount |
|---|---|---|---|
| Open | Fall Matthew | $58,800 | |
| Closed | Cavilon Properties Lc | $58,800 | |
| Previous Owner | Fall Matthew | $49,900 |
Source: Public Records
Tax History Compared to Growth
Tax History
| Year | Tax Paid | Tax Assessment Tax Assessment Total Assessment is a certain percentage of the fair market value that is determined by local assessors to be the total taxable value of land and additions on the property. | Land | Improvement |
|---|---|---|---|---|
| 2024 | $18 | $81,000 | $19,000 | $62,000 |
| 2023 | $1,668 | $81,000 | $19,000 | $62,000 |
| 2022 | $1,521 | $81,000 | $19,000 | $62,000 |
| 2021 | $1,464 | $81,000 | $19,000 | $62,000 |
| 2020 | $1,544 | $81,000 | $19,000 | $62,000 |
| 2019 | $1,481 | $58,300 | $20,700 | $37,600 |
| 2018 | $1,461 | $58,300 | $20,700 | $37,600 |
| 2017 | $1,472 | $58,300 | $20,700 | $37,600 |
| 2016 | $1,472 | $58,300 | $20,700 | $37,600 |
| 2015 | $1,523 | $58,300 | $20,700 | $37,600 |
| 2014 | $1,338 | $58,300 | $20,700 | $37,600 |
| 2013 | $1,270 | $58,300 | $20,700 | $37,600 |
Source: Public Records
Map
Nearby Homes
- 1685 178th St Dalton Farm Road Lot 25
- 1110 Eulaine Cir
- 1415 Meadows Dr
- 415 Johnson Pkwy
- 792 186th St
- 754 190th St
- 747 165th Ave
- 720 165th St
- 745 165th St
- 747 165th St
- 729 163rd St
- 727 163rd St
- 1643 75th Ave
- 1639 75th Ave
- 1613 75th Ave
- 1637 75th Ave
- 1635 75th Ave
- 1637 72nd Ave
- 1632 72nd Ave
- 988 County Road T
- 920 Davis St Unit Hammond UP 3 BR
- 920 Davis St Unit Hammond DOWN 2 BR
- 940 Davis St
- 910 Davis St
- 948 Charlotte St
- 960 Davis St
- 925 Main St
- 975 Larcom St
- 955 Larcom St
- 935 Davis St
- 921 921 Charlotte St
- 915 Davis St
- 985/987 985 987 Davis-Street-
- 985 Davis St
- 945 Davis St
- 975 Davis St
- 979 Davis St
- 955 Charlotte St
- 855 Davis St
- 865 Davis St