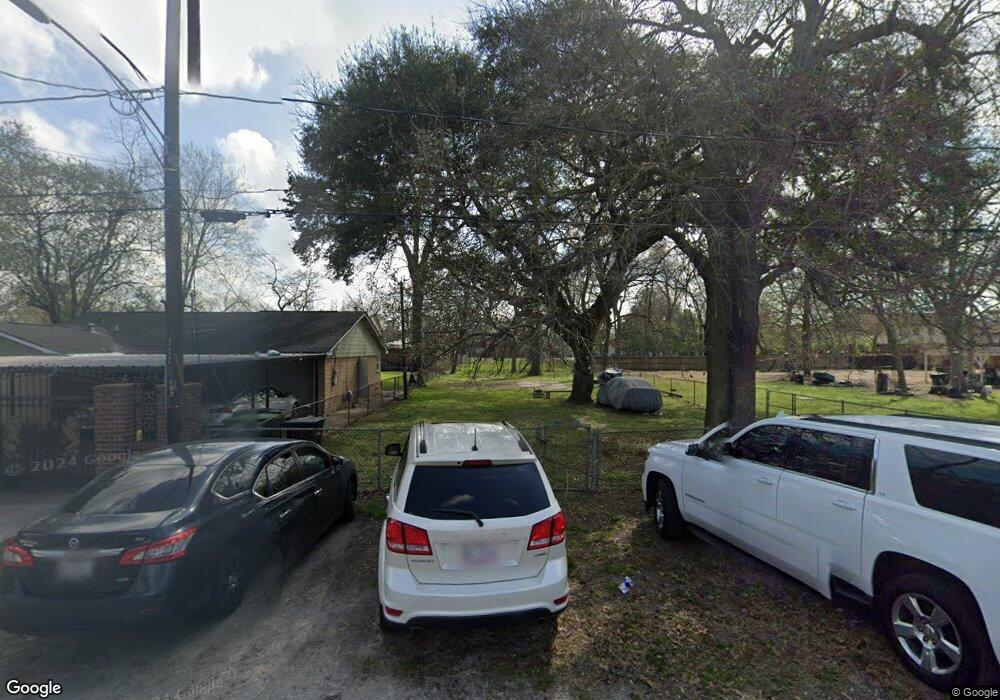
920 De Boll St Houston, TX 77022
Northside-Northline NeighborhoodEstimated Value: $302,000 - $863,000
2
Beds
1
Bath
976
Sq Ft
$567/Sq Ft
Est. Value
About This Home
This home is located at 920 De Boll St, Houston, TX 77022 and is currently estimated at $553,667, approximately $567 per square foot. 920 De Boll St is a home located in Harris County with nearby schools including Burbank Elementary School, Burbank Middle School, and Sam Houston Math, Science & Technology Center.
Ownership History
Date
Name
Owned For
Owner Type
Purchase Details
Closed on
Jul 2, 2015
Sold by
Villegas Erica
Bought by
Villegas Michelle
Current Estimated Value
Purchase Details
Closed on
Dec 15, 2014
Sold by
Salvador Carmina and Villegas John Paul
Bought by
Villegas Michelle
Purchase Details
Closed on
Oct 27, 2014
Sold by
Villegas Michelle
Bought by
Villegas Erica and Villegas Nicholas
Create a Home Valuation Report for This Property
The Home Valuation Report is an in-depth analysis detailing your home's value as well as a comparison with similar homes in the area
Home Values in the Area
Average Home Value in this Area
Purchase History
| Date | Buyer | Sale Price | Title Company |
|---|---|---|---|
| Villegas Michelle | -- | Attorney | |
| Villegas Michelle | -- | Attorney | |
| Villegas Erica | -- | None Available | |
| Salvador Carmina | -- | None Available | |
| Villegas Michelle | -- | None Available | |
| Villegas Maria De Los Angeles | -- | None Available |
Source: Public Records
Tax History Compared to Growth
Tax History
| Year | Tax Paid | Tax Assessment Tax Assessment Total Assessment is a certain percentage of the fair market value that is determined by local assessors to be the total taxable value of land and additions on the property. | Land | Improvement |
|---|---|---|---|---|
| 2025 | $1,441 | $102,600 | $102,600 | -- |
| 2024 | $1,441 | $94,163 | $94,163 | -- |
| 2023 | $1,156 | $57,375 | $57,375 | $0 |
| 2022 | $1,263 | $57,375 | $57,375 | $0 |
| 2021 | $1,337 | $57,375 | $57,375 | $0 |
| 2020 | $1,389 | $57,375 | $57,375 | $0 |
| 2019 | $1,196 | $47,250 | $47,250 | $0 |
| 2018 | $999 | $39,488 | $39,488 | $0 |
| 2017 | $998 | $39,488 | $39,488 | $0 |
| 2016 | $939 | $37,125 | $37,125 | $0 |
| 2015 | $697 | $27,100 | $27,000 | $100 |
| 2014 | $697 | $27,100 | $27,000 | $100 |
Source: Public Records
Map
Nearby Homes
- 807 Firnat St
- 1207 Firnat St
- 723 Doverside St
- 702 Pennington St
- 9026 Mcgallion Rd
- 88 Berry Rd
- 1104 Charnwood St
- 8411 Berry Brush Ln
- 8402 Berry Green Ln
- 318 Charlock St
- 802 Berry Sage Ln
- 411 Berry Rd
- 253 De Boll St
- 249 De Boll St
- 8205 Appleton St
- 216 Burress St
- 631 Apache St
- 743 Apache St
- 415 Briarcliff Dr
- 714 Apache St
- 922 De Boll St
- 924 De Boll St
- 908 De Boll St
- 915 De Boll St
- 820 De Boll St
- 903 Firnat St
- 903 Firnat St
- 919 De Boll St
- 913 De Boll St
- 812 1/2 De Boll St
- 9019 Irvington Blvd
- 911 De Boll St
- 9011 Irvington Blvd
- 9101 Irvington Blvd
- 808 De Boll St
- 821 De Boll St
- 923 De Boll St
- 811 Firnat St
- 813 De Boll St
- 826 Hohl St