NOT LISTED FOR SALE

Estimated Value: $694,078 - $978,000

-- Bed
-- Bath
1,760 Sq Ft
$481/Sq Ft Est. Value

Last Sold May 06, 2022

Last sale price $820,000 $466 Per Sq Ft

Est. 3% increase in value since last sale

Current estimated payment $5,165/month

About This Home

As of May 2022

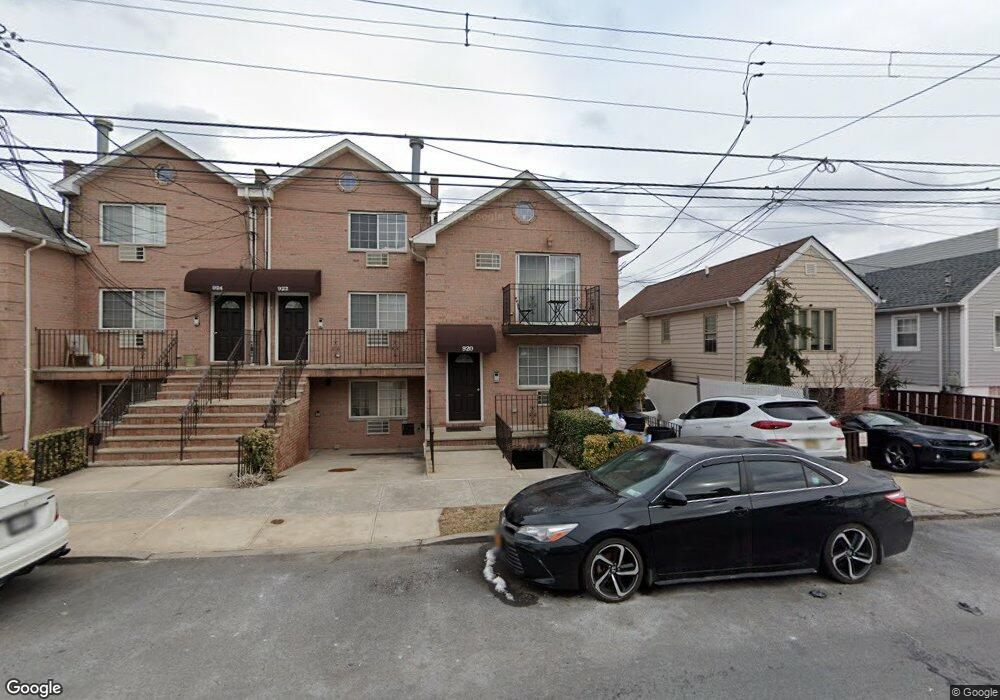
Brick, 2 family with fin basement. 2 bedroom 2 bath over 2 bedroom 2 bath. 3 boilers, driveway parking. laundry access for tenanats.

Ownership History

Date Name Owned For Owner Type

Purchase Details

Listed on
Mar 4, 2022
Closed on
May 6, 2022
Sold by
Pesce Properties Llc
Bought by
Dong Ying and Ying Changxin
Seller's Agent
Christina De Luca
De Luca Realty Group INC
List Price
$928,000
Sold Price
$820,000
Premium/Discount to List
-$108,000
-11.64%
Current Estimated Value
$846,270

Home Financials for this Owner

Home Financials are based on the most recent Mortgage that was taken out on this home.
Estimated Appreciation
$26,270
Avg. Annual Appreciation
0.93%
Original Mortgage
$550,000
Outstanding Balance
$521,780
Interest Rate
5.1%
Mortgage Type
Purchase Money Mortgage
Estimated Equity
$324,490

Purchase Details

Closed on
Sep 23, 2014
Sold by
Pesce Giacomo
Bought by
Pesce Properties Llc
Source: Public Records

Range of Values:

Collateral Analytics

Collateral Analytics Collateral Analytics AVMs (Automated Valuation Model) employ a number of statistical approaches combined with neighborhood-specific comparable selection guarantees the most up-to-date and precise valuations.

Not Available

Collateral Analytics does not have data for the current month. Please view the chart for historical values.

ICE

ICE Mortgage Technology ICE Mortgage Technology’s AVM (Automated Valuation Model) is a state-of-the-art online residential property valuation tool that provides a quick and accurate estimate of the value of almost any home in the U.S.

Not Available

ICE Mortgage Technology does not have data for the current month. Please view the chart for historical values.

First American

First American First American Data & Analytics’ next-generation AVM combines unrivaled data assets with a blended ensemble of valuation models to produce highly accurate, reliable valuations you can trust.

Not Available

First American does not have data for the current month. Please view the chart for historical values.

Quantarium

Quantarium Quantarium’s valuation service, repeatedly proven the industry’s most accurate and comprehensive, is supercharged with a self-learning and auto-tuning AI engine that continually becomes smarter and more accurate as it processes daily inputs from the industry’s leading RE data lake.

Not Available

Quantarium does not have data for the current month. Please view the chart for historical values.

Average Value
Not Available
List Price
Sold Price
Create a Home Valuation Report for This Property
The Home Valuation Report is an in-depth analysis detailing your home's value as well as a comparison with similar homes in the area

Home Values in the Area

Source: Public Records

Average Home Value in this Area


Source: Public Records

Purchase History

Date Buyer Sale Price Title Company
Dong Ying $800,000 --
Pesce Properties Llc -- --
Source: Public Records

Mortgage History

Date Status Borrower Loan Amount
Open Dong Ying $550,000
Closed Dong Ying $550,000
Source: Public Records

Property History

Date Event Price List to Sale Price per Sq Ft Prior Sale
05/06/2022 05/06/22 Sold $820,000 -11.6% $466 / Sq Ft View Prior Sale
03/07/2022 03/07/22 Pending -- -- --
03/04/2022 03/04/22 For Sale $928,000 -- $527 / Sq Ft

Tax History Compared to Growth

Source: Public Records

Tax History

Year Tax Paid Tax Assessment Tax Assessment Total Assessment is a certain percentage of the fair market value that is determined by local assessors to be the total taxable value of land and additions on the property. Land Improvement
2025 $7,932 $41,863 $6,623 $35,240
2024 $7,932 $39,494 $6,376 $33,118
2023 $7,932 $39,494 $5,803 $33,691
2022 $7,793 $49,320 $8,040 $41,280
2021 $7,751 $41,280 $8,040 $33,240
2020 $7,384 $40,260 $8,040 $32,220
2019 $6,885 $36,840 $8,040 $28,800
2018 $6,709 $32,912 $8,004 $24,908
2017 $6,632 $32,532 $7,241 $25,291
2016 $6,135 $30,691 $6,559 $24,132
2015 $2,492 $29,072 $7,805 $21,267
2014 $2,492 $27,427 $8,340 $19,087
Source: Public Records

Agents Affiliated with this Home

  • Section Image
See All Agents

Map