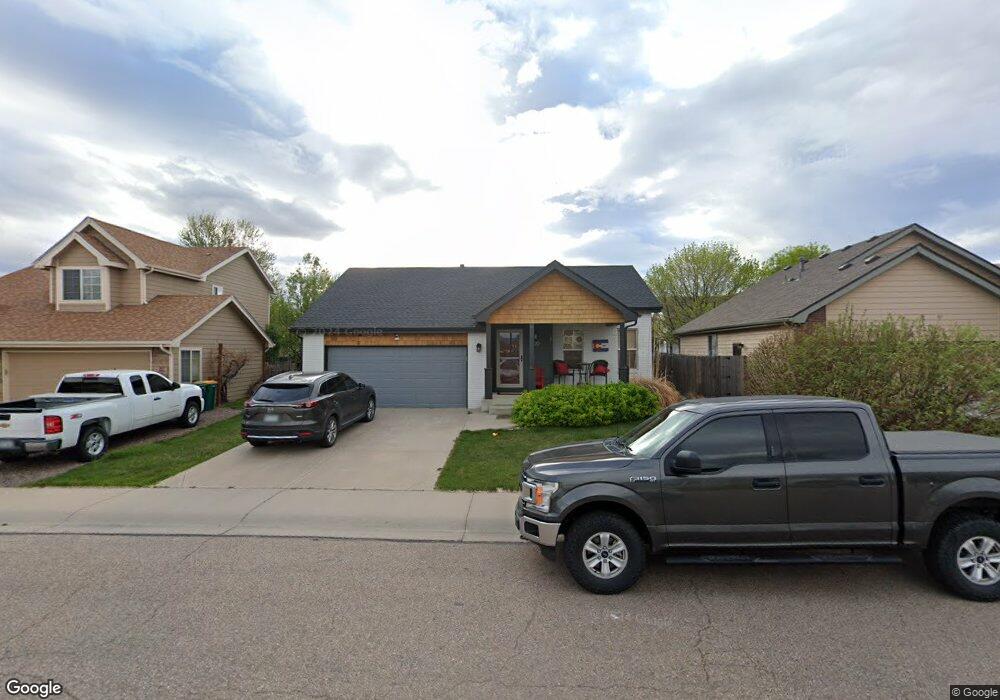
920 Durum Ct Windsor, CO 80550
Estimated Value: $472,895 - $571,000
3
Beds
2
Baths
1,313
Sq Ft
$388/Sq Ft
Est. Value
About This Home
This home is located at 920 Durum Ct, Windsor, CO 80550 and is currently estimated at $508,974, approximately $387 per square foot. 920 Durum Ct is a home located in Weld County with nearby schools including Grandview Elementary School, Windsor Middle School, and Windsor High School.
Ownership History
Date
Name
Owned For
Owner Type
Purchase Details
Closed on
Sep 2, 2005
Sold by
Neuenschwander Scott J and Mondok Trina M
Bought by
Mondok Trina M
Current Estimated Value
Home Financials for this Owner
Home Financials are based on the most recent Mortgage that was taken out on this home.
Original Mortgage
$173,600
Outstanding Balance
$91,429
Interest Rate
5.7%
Mortgage Type
Stand Alone Refi Refinance Of Original Loan
Estimated Equity
$417,545
Purchase Details
Closed on
Jun 25, 2004
Sold by
Shepardson Homes Ltd
Bought by
Mondok Trina M and Neuenschwander Scott J
Home Financials for this Owner
Home Financials are based on the most recent Mortgage that was taken out on this home.
Original Mortgage
$191,987
Interest Rate
6.32%
Mortgage Type
FHA
Create a Home Valuation Report for This Property
The Home Valuation Report is an in-depth analysis detailing your home's value as well as a comparison with similar homes in the area
Purchase History
| Date | Buyer | Sale Price | Title Company |
|---|---|---|---|
| Mondok Trina M | -- | -- | |
| Mondok Trina M | $195,000 | -- |
Source: Public Records
Mortgage History
| Date | Status | Borrower | Loan Amount |
|---|---|---|---|
| Open | Mondok Trina M | $173,600 | |
| Closed | Mondok Trina M | $191,987 |
Source: Public Records
Tax History
| Year | Tax Paid | Tax Assessment Tax Assessment Total Assessment is a certain percentage of the fair market value that is determined by local assessors to be the total taxable value of land and additions on the property. | Land | Improvement |
|---|---|---|---|---|
| 2025 | $2,677 | $30,780 | $6,560 | $24,220 |
| 2024 | $2,677 | $30,780 | $6,560 | $24,220 |
| 2023 | $2,458 | $31,930 | $4,870 | $27,060 |
| 2022 | $2,407 | $24,690 | $4,930 | $19,760 |
| 2021 | $2,245 | $25,410 | $5,080 | $20,330 |
| 2020 | $2,037 | $23,510 | $4,430 | $19,080 |
| 2019 | $2,019 | $23,510 | $4,430 | $19,080 |
| 2018 | $1,700 | $18,740 | $2,880 | $15,860 |
| 2017 | $1,799 | $18,740 | $2,880 | $15,860 |
| 2016 | $1,620 | $17,040 | $2,950 | $14,090 |
| 2015 | $1,507 | $17,040 | $2,950 | $14,090 |
| 2014 | $1,371 | $14,530 | $2,630 | $11,900 |
Source: Public Records
Map
Nearby Homes
Your Personal Tour Guide
Ask me questions while you tour the home.