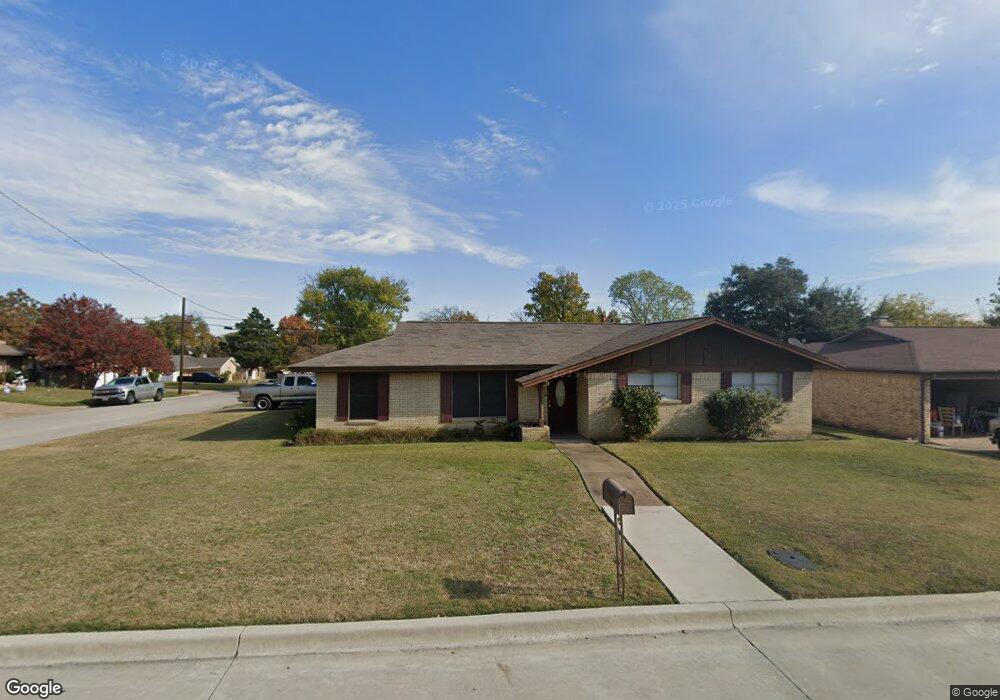
920 Gregory Ave Bedford, TX 76022
Estimated Value: $320,065 - $338,000
3
Beds
2
Baths
1,689
Sq Ft
$194/Sq Ft
Est. Value
About This Home
This home is located at 920 Gregory Ave, Bedford, TX 76022 and is currently estimated at $327,766, approximately $194 per square foot. 920 Gregory Ave is a home located in Tarrant County with nearby schools including Bell Manor Elementary School, Central J High School, and Trinity High School.
Ownership History
Date
Name
Owned For
Owner Type
Purchase Details
Closed on
Dec 10, 2003
Sold by
Colby John and Stanley Michael L
Bought by
920 Gregory Llc
Current Estimated Value
Purchase Details
Closed on
Sep 19, 1996
Sold by
Stanley Michael
Bought by
Colby John
Purchase Details
Closed on
Aug 4, 1995
Sold by
Colby Stanley Homes Inc
Bought by
Colby John and Stanley Michael L
Home Financials for this Owner
Home Financials are based on the most recent Mortgage that was taken out on this home.
Original Mortgage
$56,000
Interest Rate
7.77%
Mortgage Type
Assumption
Purchase Details
Closed on
Jul 5, 1995
Sold by
Heritage Garth H and Heritage Garth Henry
Bought by
Colby Stanley Homes Inc
Home Financials for this Owner
Home Financials are based on the most recent Mortgage that was taken out on this home.
Original Mortgage
$56,000
Interest Rate
7.77%
Mortgage Type
Assumption
Create a Home Valuation Report for This Property
The Home Valuation Report is an in-depth analysis detailing your home's value as well as a comparison with similar homes in the area
Home Values in the Area
Average Home Value in this Area
Purchase History
| Date | Buyer | Sale Price | Title Company |
|---|---|---|---|
| 920 Gregory Llc | -- | -- | |
| Colby John | -- | Trinity Western Title Co | |
| Colby John | -- | Trinity Western Title Co | |
| Colby Stanley Homes Inc | -- | Trinity Western Title Co | |
| Heritage Garth H | -- | Trinity Western Title Co |
Source: Public Records
Mortgage History
| Date | Status | Borrower | Loan Amount |
|---|---|---|---|
| Previous Owner | Colby John | $56,000 | |
| Previous Owner | Heritage Garth H | $56,000 | |
| Closed | Colby John | $0 |
Source: Public Records
Tax History Compared to Growth
Tax History
| Year | Tax Paid | Tax Assessment Tax Assessment Total Assessment is a certain percentage of the fair market value that is determined by local assessors to be the total taxable value of land and additions on the property. | Land | Improvement |
|---|---|---|---|---|
| 2025 | $3,759 | $158,765 | $65,000 | $93,765 |
| 2024 | $3,759 | $193,098 | $65,000 | $128,098 |
| 2023 | $3,965 | $206,711 | $45,000 | $161,711 |
| 2022 | $3,646 | $166,949 | $45,000 | $121,949 |
| 2021 | $3,870 | $164,309 | $45,000 | $119,309 |
| 2020 | $4,070 | $171,200 | $45,000 | $126,200 |
| 2019 | $4,159 | $171,200 | $45,000 | $126,200 |
| 2018 | $3,558 | $146,465 | $25,000 | $121,465 |
| 2017 | $3,733 | $154,318 | $25,000 | $129,318 |
| 2016 | $2,046 | $84,580 | $25,000 | $59,580 |
| 2015 | $2,288 | $65,989 | $22,000 | $43,989 |
| 2014 | $2,288 | $91,100 | $18,000 | $73,100 |
Source: Public Records
Map
Nearby Homes
- 828 Gregory Ave
- 808 Gregory Ave
- 2101 Gettysburg Place
- 800 Prestwick St
- 1049 Stableway Ln
- 2024 Charleston Dr
- 2420 Dalewood Ln
- 1116 Highpoint Rd
- 2428 Chestnut Way
- 1213 Greendale Dr
- 2620 Britany Cir
- 2201 Greendale Ct
- 952 Charleston Dr
- 804 Natchez Ave
- 1216 Princeton Place
- 2421 Creek Villas Dr
- 2025 Schumac Ln
- 2504 Westpark Way Cir
- 933 Charleston Ct
- 2303 Mcmullin Dr
- 916 Gregory Ave
- 929 Prestwick St
- 925 Prestwick St
- 2305 Gettysburg Place
- 2217 Gettysburg Place
- 2309 Gettysburg Place
- 921 Gregory Ave
- 2213 Gettysburg Place
- 921 Prestwick St
- 917 Gregory Ave
- 2313 Gettysburg Place
- 2209 Gettysburg Place
- 908 Gregory Ave
- 917 Prestwick St
- 913 Gregory Ave
- 2232 Oak Hill Dr
- 2236 Oak Hill Dr
- 928 Prestwick St
- 2401 Gettysburg Place
- 2205 Gettysburg Place