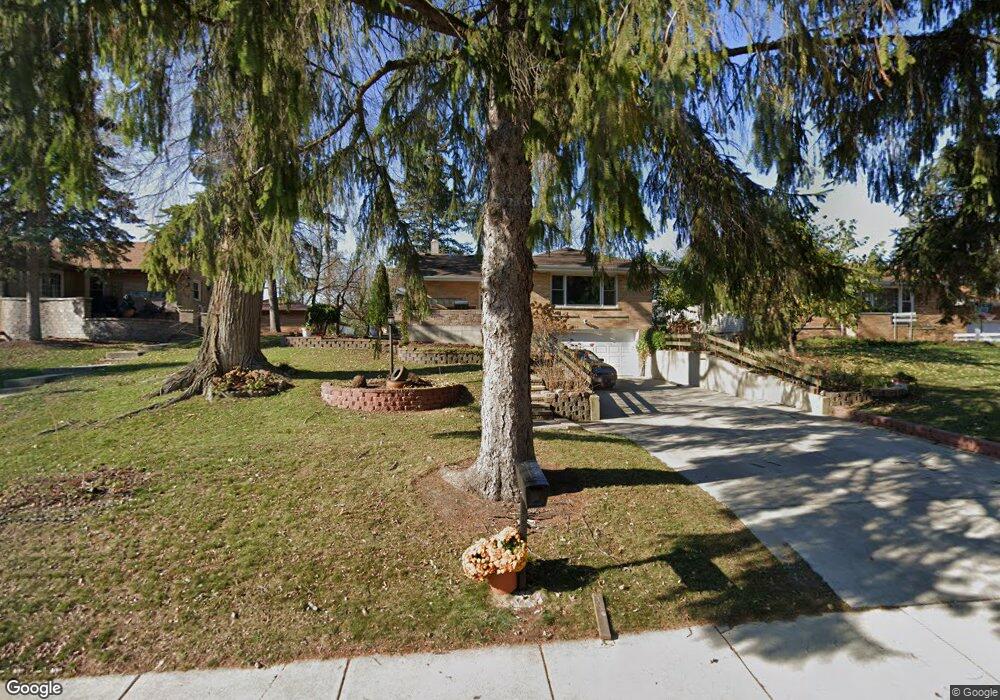
920 Hahn Place West Chicago, IL 60185
Chicago West NeighborhoodEstimated Value: $297,000 - $338,000
3
Beds
2
Baths
1,290
Sq Ft
$241/Sq Ft
Est. Value
About This Home
This home is located at 920 Hahn Place, West Chicago, IL 60185 and is currently estimated at $311,500, approximately $241 per square foot. 920 Hahn Place is a home located in DuPage County with nearby schools including Currier Elementary School, Leman Middle School, and West Chicago Community High School.
Ownership History
Date
Name
Owned For
Owner Type
Purchase Details
Closed on
Apr 4, 2011
Sold by
Trucap Reo Corp
Bought by
Garcia Reyna
Current Estimated Value
Home Financials for this Owner
Home Financials are based on the most recent Mortgage that was taken out on this home.
Original Mortgage
$77,350
Outstanding Balance
$53,514
Interest Rate
4.86%
Mortgage Type
New Conventional
Estimated Equity
$257,986
Purchase Details
Closed on
Nov 5, 2010
Sold by
Rubio Rosalina
Bought by
Trucap Reo Corp
Purchase Details
Closed on
Mar 15, 2007
Sold by
Rubio Rosalina
Bought by
Rodriguez Hector G
Purchase Details
Closed on
Dec 13, 2006
Sold by
Escobedo Pablo
Bought by
Rubio Rosalina
Home Financials for this Owner
Home Financials are based on the most recent Mortgage that was taken out on this home.
Original Mortgage
$188,000
Interest Rate
7.95%
Mortgage Type
Purchase Money Mortgage
Create a Home Valuation Report for This Property
The Home Valuation Report is an in-depth analysis detailing your home's value as well as a comparison with similar homes in the area
Home Values in the Area
Average Home Value in this Area
Purchase History
| Date | Buyer | Sale Price | Title Company |
|---|---|---|---|
| Garcia Reyna | $91,000 | First American Title | |
| Trucap Reo Corp | -- | None Available | |
| Rodriguez Hector G | -- | None Available | |
| Rubio Rosalina | $235,000 | None Available |
Source: Public Records
Mortgage History
| Date | Status | Borrower | Loan Amount |
|---|---|---|---|
| Open | Garcia Reyna | $77,350 | |
| Previous Owner | Rubio Rosalina | $188,000 |
Source: Public Records
Tax History Compared to Growth
Tax History
| Year | Tax Paid | Tax Assessment Tax Assessment Total Assessment is a certain percentage of the fair market value that is determined by local assessors to be the total taxable value of land and additions on the property. | Land | Improvement |
|---|---|---|---|---|
| 2024 | $6,381 | $79,796 | $18,394 | $61,402 |
| 2023 | $6,018 | $72,880 | $16,800 | $56,080 |
| 2022 | $5,880 | $68,130 | $15,710 | $52,420 |
| 2021 | $5,656 | $65,310 | $15,060 | $50,250 |
| 2020 | $5,447 | $63,240 | $14,600 | $48,640 |
| 2019 | $5,281 | $60,220 | $13,900 | $46,320 |
| 2018 | $4,953 | $55,780 | $12,880 | $42,900 |
| 2017 | $4,822 | $53,000 | $12,240 | $40,760 |
| 2016 | $4,669 | $48,730 | $11,410 | $37,320 |
| 2015 | $4,551 | $45,110 | $10,560 | $34,550 |
| 2014 | $4,586 | $45,110 | $10,550 | $34,560 |
| 2013 | $4,655 | $46,760 | $10,940 | $35,820 |
Source: Public Records
Map
Nearby Homes
- 821 Bishop St
- 29W139 Barnes Ave
- 0N230 Easton Ave
- 264 Augusta Ave
- 1350 Sarana Ave
- 29W034 Lester St
- Lot 1 Wycliffe Dr
- 143 Conde St
- 28W659 Lester St
- 129 W Blair St
- 28W605 Barnes Ave
- 550 Main St Unit 215
- 228 Chicago St
- 34 S Lake Dr
- 200 Fulton St
- 209 E Washington St
- 130 Sophia St
- 125 Arbor Ave
- 433 Virgie Place
- 212 N Oakwood Ave