
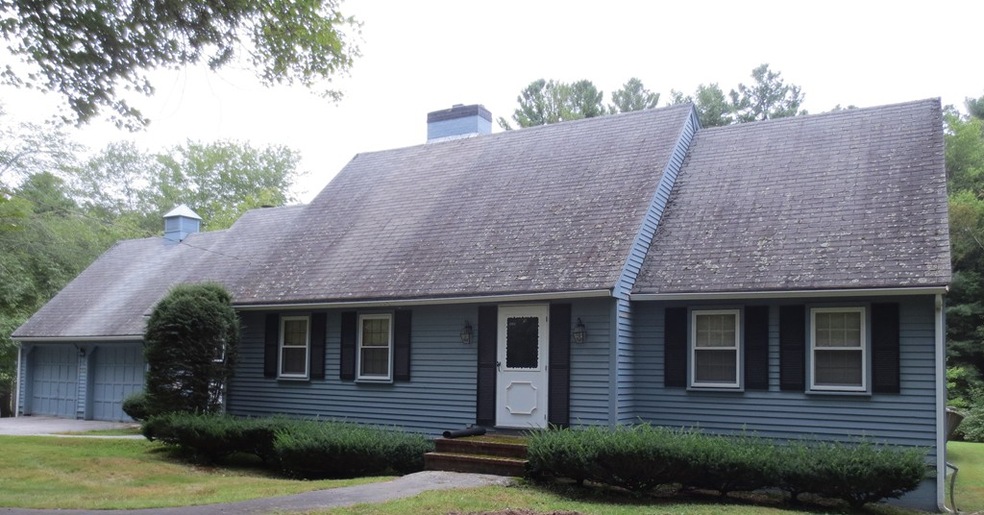
920 Johnson St North Andover, MA 01845
5
Beds
2
Baths
2,392
Sq Ft
1.01
Acres
Highlights
- Wood Flooring
- Screened Porch
- Security Service
- North Andover High School Rated A-
- Fenced Yard
- Central Vacuum
About This Home
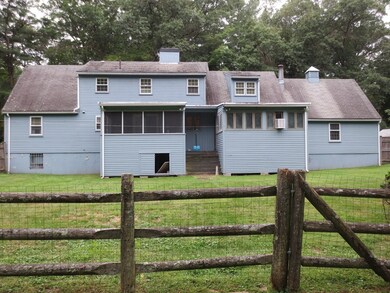
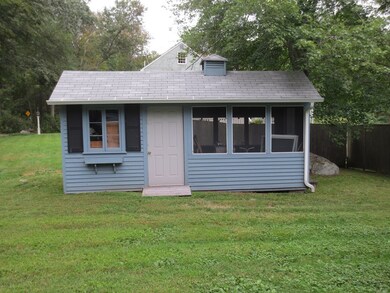
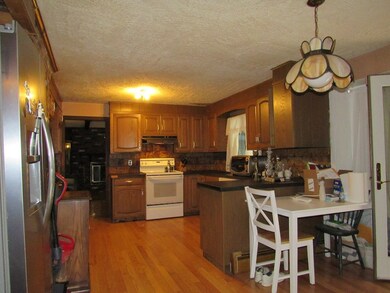
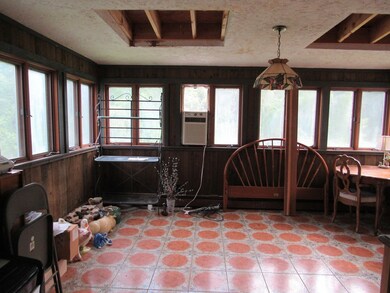
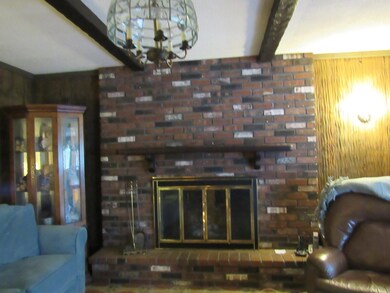
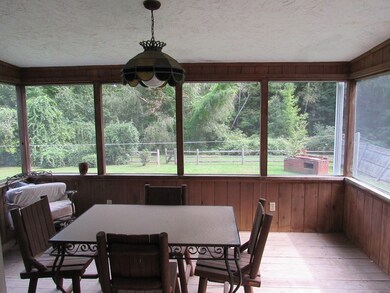
As of December 2023Sprawling Cape on approximately 1 acre with 5 bedrooms, 2 on first floor. Fireplaced living room with hardwood floor. Fireplaced family room with tile floor. First floor features family room, kitchen, dining area, living room, 2 bedrooms and full bath. Screened in porch off dining area. Second floor features 3 bedrooms - one of the bedrooms is a 2 room suite, and 3/4 bath with large shower. Hardwood throughout other than tiled family room (no carpeting. Laminate in kitchen). 2 car attached garage opens to mud room with large closet. Shed, exterior brick cooking area and screened-in exterior building. Basement has walk out glass doors to exterior. Conveniently located to Old North Andover Center and Route 114. This property is a diamond in the rough - repairs and updating needed - property is priced accordingly.
Home Details
Home Type
- Single Family
Est. Annual Taxes
- $9,485
Year Built
- Built in 1968
Lot Details
- Fenced Yard
- Property is zoned R2
Parking
- 2 Car Garage
Interior Spaces
- Central Vacuum
- Screened Porch
- Basement
Kitchen
- Range
- Dishwasher
Flooring
- Wood
- Tile
Outdoor Features
- Storage Shed
Utilities
- Hot Water Baseboard Heater
- Heating System Uses Gas
- Natural Gas Water Heater
- Private Sewer
Community Details
- Security Service
Listing and Financial Details
- Assessor Parcel Number M:00107 B:A0090 L:00000
Ownership History
Date
Name
Owned For
Owner Type
Purchase Details
Listed on
Apr 12, 2019
Closed on
Oct 17, 2019
Sold by
Kreative Property Solutns
Bought by
Whitehead Lisa and Whitehead Kenneth
Seller's Agent
Greater Boston Home Team
Greater Boston Home Buying
Buyer's Agent
Greater Boston Home Team
Greater Boston Home Buying
List Price
$665,000
Sold Price
$620,000
Premium/Discount to List
-$45,000
-6.77%
Current Estimated Value
Home Financials for this Owner
Home Financials are based on the most recent Mortgage that was taken out on this home.
Estimated Appreciation
$359,455
Avg. Annual Appreciation
8.13%
Original Mortgage
$465,000
Interest Rate
3.5%
Mortgage Type
New Conventional
Purchase Details
Listed on
Sep 19, 2018
Closed on
Nov 13, 2018
Sold by
Alberta Rt and Mcmains
Bought by
Kreative Property Solu
Seller's Agent
Janice Pierro
McKeon / Corcoran Real Estate
Buyer's Agent
Greater Boston Home Team
Greater Boston Home Buying
List Price
$469,900
Sold Price
$400,000
Premium/Discount to List
-$69,900
-14.88%
Home Financials for this Owner
Home Financials are based on the most recent Mortgage that was taken out on this home.
Avg. Annual Appreciation
58.62%
Original Mortgage
$433,250
Interest Rate
4.7%
Mortgage Type
New Conventional
Purchase Details
Closed on
Feb 10, 2010
Sold by
Mcmains Alberta C
Bought by
Alberta Rt and Mcmains
Purchase Details
Closed on
Jan 1, 1972
Bought by
Alberta Rt
Similar Homes in North Andover, MA
Create a Home Valuation Report for This Property
The Home Valuation Report is an in-depth analysis detailing your home's value as well as a comparison with similar homes in the area
Home Values in the Area
Average Home Value in this Area
Purchase History
| Date | Type | Sale Price | Title Company |
|---|---|---|---|
| Not Resolvable | $620,000 | -- | |
| Deed | $400,000 | -- | |
| Deed | -- | -- | |
| Deed | -- | -- |
Source: Public Records
Mortgage History
| Date | Status | Loan Amount | Loan Type |
|---|---|---|---|
| Open | $269,000 | Purchase Money Mortgage | |
| Open | $621,000 | Commercial | |
| Closed | $465,000 | New Conventional | |
| Previous Owner | $433,250 | New Conventional | |
| Previous Owner | $160,000 | No Value Available | |
| Previous Owner | $157,000 | No Value Available | |
| Previous Owner | $176,000 | No Value Available |
Source: Public Records
Property History
| Date | Event | Price | Change | Sq Ft Price |
|---|---|---|---|---|
| 12/15/2023 12/15/23 | Sold | $875,000 | -2.7% | $320 / Sq Ft |
| 11/08/2023 11/08/23 | Pending | -- | -- | -- |
| 11/02/2023 11/02/23 | For Sale | $899,000 | +45.0% | $328 / Sq Ft |
| 10/23/2019 10/23/19 | Sold | $620,000 | -0.8% | $259 / Sq Ft |
| 09/29/2019 09/29/19 | Pending | -- | -- | -- |
| 09/13/2019 09/13/19 | Price Changed | $625,000 | -1.3% | $261 / Sq Ft |
| 08/16/2019 08/16/19 | Price Changed | $633,000 | -2.4% | $265 / Sq Ft |
| 07/26/2019 07/26/19 | Price Changed | $648,500 | -0.2% | $271 / Sq Ft |
| 06/12/2019 06/12/19 | Price Changed | $649,500 | -0.8% | $272 / Sq Ft |
| 06/04/2019 06/04/19 | Price Changed | $654,900 | -1.5% | $274 / Sq Ft |
| 05/02/2019 05/02/19 | For Sale | $665,000 | +7.3% | $278 / Sq Ft |
| 04/19/2019 04/19/19 | Off Market | $620,000 | -- | -- |
| 04/12/2019 04/12/19 | For Sale | $665,000 | +66.3% | $278 / Sq Ft |
| 11/09/2018 11/09/18 | Sold | $400,000 | -9.1% | $167 / Sq Ft |
| 10/18/2018 10/18/18 | Pending | -- | -- | -- |
| 10/08/2018 10/08/18 | Price Changed | $439,900 | -6.4% | $184 / Sq Ft |
| 09/19/2018 09/19/18 | For Sale | $469,900 | -- | $196 / Sq Ft |
Source: MLS Property Information Network (MLS PIN)
Tax History Compared to Growth
Tax History
| Year | Tax Paid | Tax Assessment Tax Assessment Total Assessment is a certain percentage of the fair market value that is determined by local assessors to be the total taxable value of land and additions on the property. | Land | Improvement |
|---|---|---|---|---|
| 2025 | $9,485 | $842,400 | $413,900 | $428,500 |
| 2024 | $8,319 | $750,100 | $392,100 | $358,000 |
| 2023 | $7,834 | $640,000 | $331,200 | $308,800 |
| 2022 | $7,573 | $559,700 | $287,600 | $272,100 |
| 2021 | $7,561 | $533,600 | $261,500 | $272,100 |
| 2020 | $6,580 | $478,900 | $254,900 | $224,000 |
| 2019 | $6,698 | $499,500 | $254,900 | $244,600 |
| 2018 | $7,258 | $499,500 | $254,900 | $244,600 |
| 2017 | $7,069 | $495,000 | $224,400 | $270,600 |
| 2016 | $7,041 | $493,400 | $226,600 | $266,800 |
| 2015 | $6,631 | $460,800 | $213,100 | $247,700 |
Source: Public Records
Agents Affiliated with this Home
-
Douglas Mesquita
Seller's Agent in 2023
Douglas Mesquita
BENJAMIN Apartments + Cityside Homes
(781) 799-7223
1 in this area
5 Total Sales
-
Bryan Perreira
Buyer's Agent in 2023
Bryan Perreira
Laer Realty
(978) 337-0682
4 in this area
115 Total Sales
-
Greater Boston Home Team
G
Seller's Agent in 2019
Greater Boston Home Team
Greater Boston Home Buying
(617) 520-4547
3 in this area
89 Total Sales
-
Janice Pierro
J
Seller's Agent in 2018
Janice Pierro
McKeon / Corcoran Real Estate
(978) 973-7442
6 Total Sales
Map
Source: MLS Property Information Network (MLS PIN)
MLS Number: 72398224
APN: NAND-000107A-000090
Disclaimer: Certain information contained herein is derived from information provided by parties other than Homes.com. All information provided is deemed reliable, but is not guaranteed to be accurate and should be independently verified.
![]() The property listing data and information, or the Images, set forth herein were provided to MLS Property Information Network, Inc. from third party sources, including sellers, lessors and public records, and were compiled by MLS Property Information Network, Inc. The property listing data and information, and the Images, are for the personal, non-commercial use of consumers having a good faith interest in purchasing or leasing listed properties of the type displayed to them and may not be used for any purpose other than to identify prospective properties which such consumers may have a good faith interest in purchasing or leasing. MLS Property Information Network, Inc. and its subscribers disclaim any and all representations and warranties as to the accuracy of the property listing data and information, or as to the accuracy of any of the Images, set forth herein.
The property listing data and information, or the Images, set forth herein were provided to MLS Property Information Network, Inc. from third party sources, including sellers, lessors and public records, and were compiled by MLS Property Information Network, Inc. The property listing data and information, and the Images, are for the personal, non-commercial use of consumers having a good faith interest in purchasing or leasing listed properties of the type displayed to them and may not be used for any purpose other than to identify prospective properties which such consumers may have a good faith interest in purchasing or leasing. MLS Property Information Network, Inc. and its subscribers disclaim any and all representations and warranties as to the accuracy of the property listing data and information, or as to the accuracy of any of the Images, set forth herein.
Nearby Homes
- 127 Tucker Farm Rd
- 404 Summer St
- 43 Mill Rd
- 82 Raleigh Tavern Ln
- 40 Flagship Dr
- 105 Weyland Cir
- 495 Johnson St
- 54 Kara Dr
- 78 Mayflower Dr Unit 78
- 62 Lisa Ln
- 124 Hillside Rd
- 246 Highland Rd
- 177 Highland Rd
- 46 Foster St
- 284 Appleton St
- 32 Monteiro Way
- 200 Sandra Ln
- 125 Lancaster Rd
- 156 Chestnut St Unit 15
- 131 Chestnut St