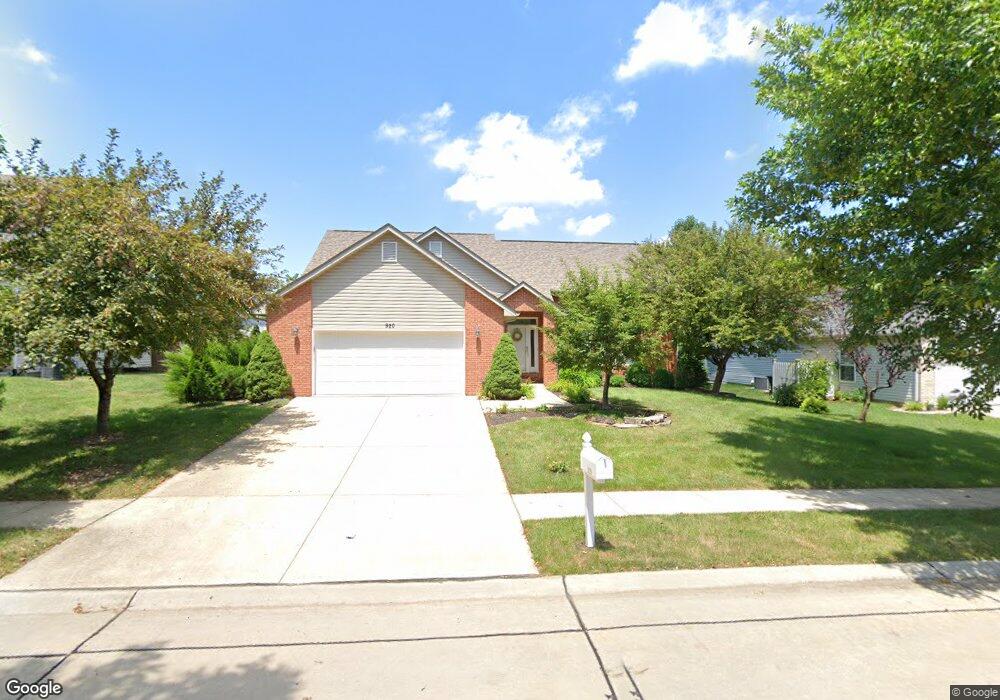
920 Jordan O Fallon, IL 62269
Estimated Value: $349,345 - $436,000
About This Home
This home is located at 920 Jordan, O Fallon, IL 62269 and is currently estimated at $387,336, approximately $219 per square foot. 920 Jordan is a home located in St. Clair County with nearby schools including Moye Elementary School, Carriel Junior High School, and O'Fallon Township High School.
Ownership History
We collect this data history from publicly available records. To have your information removed, we recommend requesting removal directly through your county’s website.
Purchase Details
Home Financials for this Owner
Home Financials are based on the most recent Mortgage that was taken out on this home.Purchase Details
Home Values in the Area
Average Home Value in this Area
Purchase History
We collect this data history from publicly available records. To have your information removed, we recommend requesting removal directly through your county’s website.
| Date | Buyer | Sale Price | Title Company |
|---|---|---|---|
| $270,000 | First County Title | ||
| -- | -- |
Mortgage History
We collect this data history from publicly available records. To have your information removed, we recommend requesting removal directly through your county’s website.
| Date | Status | Borrower | Loan Amount |
|---|---|---|---|
| Open | $201,000 |
Tax History
We collect this data history from publicly available records. To have your information removed, we recommend requesting removal directly through your county’s website.
| Year | Tax Paid | Tax Assessment Tax Assessment Total Assessment is a certain percentage of the fair market value that is determined by local assessors to be the total taxable value of land and additions on the property. | Land | Improvement |
|---|---|---|---|---|
| 2024 | $7,197 | $109,735 | $18,329 | $91,406 |
| 2023 | $6,546 | $97,395 | $16,268 | $81,127 |
| 2022 | $6,121 | $89,542 | $14,956 | $74,586 |
| 2021 | $5,952 | $85,976 | $15,003 | $70,973 |
| 2020 | $5,894 | $81,384 | $14,202 | $67,182 |
| 2019 | $5,737 | $81,384 | $14,202 | $67,182 |
| 2018 | $5,564 | $79,022 | $13,790 | $65,232 |
| 2017 | $5,713 | $75,748 | $16,027 | $59,721 |
| 2016 | $5,900 | $73,980 | $15,653 | $58,327 |
| 2014 | $5,448 | $73,124 | $15,472 | $57,652 |
| 2013 | $5,234 | $72,002 | $15,235 | $56,767 |
Map
- 953 Benjamin Dr
- 934 Thornbury Place
- 1063 Oxford Hill Rd
- 717 Cardiff Ct
- 286 Red Clover Cir
- 207 Knollhaven Trail
- 1253 Tanglewood Trace
- 1109 Whippoorwill Ct
- 150 Marigold Dr
- 513 Deer Creek Rd
- 1102 Timber Run
- 500 Shadow Rock Ct
- 1213 Tanglewood Trace
- 137 Longmeade Dr
- 520 Shadow Rock Ct
- 117 Callaway Ct
- 1046 Shadow Ridge Crossing
- 128 Callaway Ct
- 130 Hodgens Mill Ln
- 1236 & 1240 Natalyns Trace St Unit n/a
- 925 Moye School Rd
- 929 Moye School Rd
- 921 Moye School Rd
- 916 Jordan
- 917 Moye School Rd
- 924 Jordan Dr
- 924 Jordan
- 933 Moye School Rd
- 924 Moye School Rd
- 920 Moye School Rd
- 928 Moye School Rd
- 912 Jordan
- 928 Jordan
- 928 Jordan Dr
- 912 Jordan Dr
- 913 Moye School Rd
- 916 Moye School Rd
- 937 Moye School Rd
- 932 Moye School Rd
- 908 Jordan
Ask me questions while you tour the home.