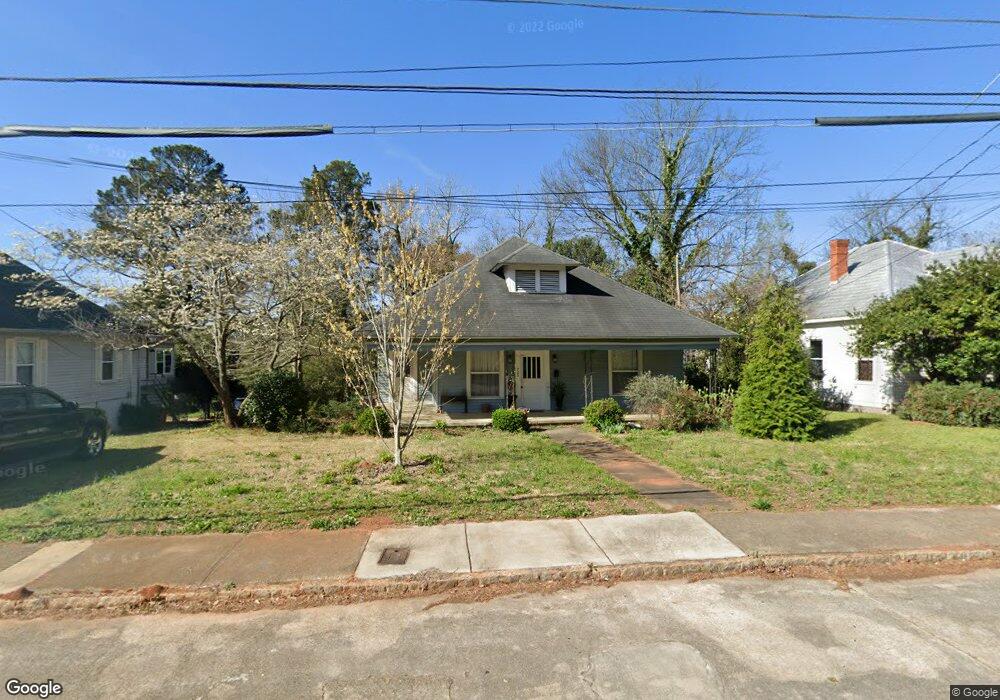
920 Laurel Ave Macon, GA 31211
North Highlands Historic District NeighborhoodEstimated Value: $122,000 - $158,000
3
Beds
2
Baths
1,532
Sq Ft
$96/Sq Ft
Est. Value
About This Home
This home is located at 920 Laurel Ave, Macon, GA 31211 and is currently estimated at $146,528, approximately $95 per square foot. 920 Laurel Ave is a home located in Bibb County with nearby schools including Burdell Elementary School, Appling Middle School, and Northeast High School.
Ownership History
Date
Name
Owned For
Owner Type
Purchase Details
Closed on
Oct 23, 2017
Sold by
Ethrdige Charlotte and Ethridge Charlotte
Bought by
Brick Investors Llc
Current Estimated Value
Purchase Details
Closed on
Oct 10, 2008
Sold by
Grinstead Charles H and Patterson Dorothy K
Bought by
Ethridge Charlotte
Home Financials for this Owner
Home Financials are based on the most recent Mortgage that was taken out on this home.
Original Mortgage
$117,740
Interest Rate
6.36%
Mortgage Type
Unknown
Create a Home Valuation Report for This Property
The Home Valuation Report is an in-depth analysis detailing your home's value as well as a comparison with similar homes in the area
Home Values in the Area
Average Home Value in this Area
Purchase History
| Date | Buyer | Sale Price | Title Company |
|---|---|---|---|
| Brick Investors Llc | -- | None Available | |
| Ethridge Charlotte | $108,000 | None Available |
Source: Public Records
Mortgage History
| Date | Status | Borrower | Loan Amount |
|---|---|---|---|
| Previous Owner | Ethridge Charlotte | $117,740 |
Source: Public Records
Tax History
| Year | Tax Paid | Tax Assessment Tax Assessment Total Assessment is a certain percentage of the fair market value that is determined by local assessors to be the total taxable value of land and additions on the property. | Land | Improvement |
|---|---|---|---|---|
| 2025 | $885 | $36,011 | $5,280 | $30,731 |
| 2024 | $879 | $34,614 | $5,280 | $29,334 |
| 2023 | $844 | $33,217 | $5,280 | $27,937 |
| 2022 | $1,028 | $29,685 | $4,928 | $24,757 |
| 2021 | $963 | $25,330 | $4,256 | $21,074 |
| 2020 | $926 | $23,859 | $3,808 | $20,051 |
| 2019 | $934 | $23,859 | $3,808 | $20,051 |
| 2018 | $1,610 | $23,859 | $3,808 | $20,051 |
| 2017 | $700 | $18,676 | $4,354 | $14,322 |
| 2016 | $646 | $18,676 | $4,354 | $14,322 |
| 2015 | $1,041 | $21,266 | $4,898 | $16,368 |
| 2014 | $1,313 | $23,312 | $4,898 | $18,414 |
Source: Public Records
Map
Nearby Homes
- 940 Curry Dr
- 1049 Boulevard
- 944 Nottingham Dr
- 833 Parkview Ct
- 965 North Ave
- 862 Parkview Dr
- 980 Curry Place
- 1158 Jackson Springs Rd
- 1006 Clay Ave Unit 1008,1020,1022
- 1020 Clay Ave
- 1174 Davis St E
- 1154 Davis Cir
- 1263 Highland Ave
- 378 Cowan St
- 390 Cowan St
- 990 Center St
- 970 Center St
- 363 AND 361 Woolfolk St
- 363 Woolfolk St Unit 361 Woolfolk Street
- 1435 Twin Pines Dr
Your Personal Tour Guide
Ask me questions while you tour the home.