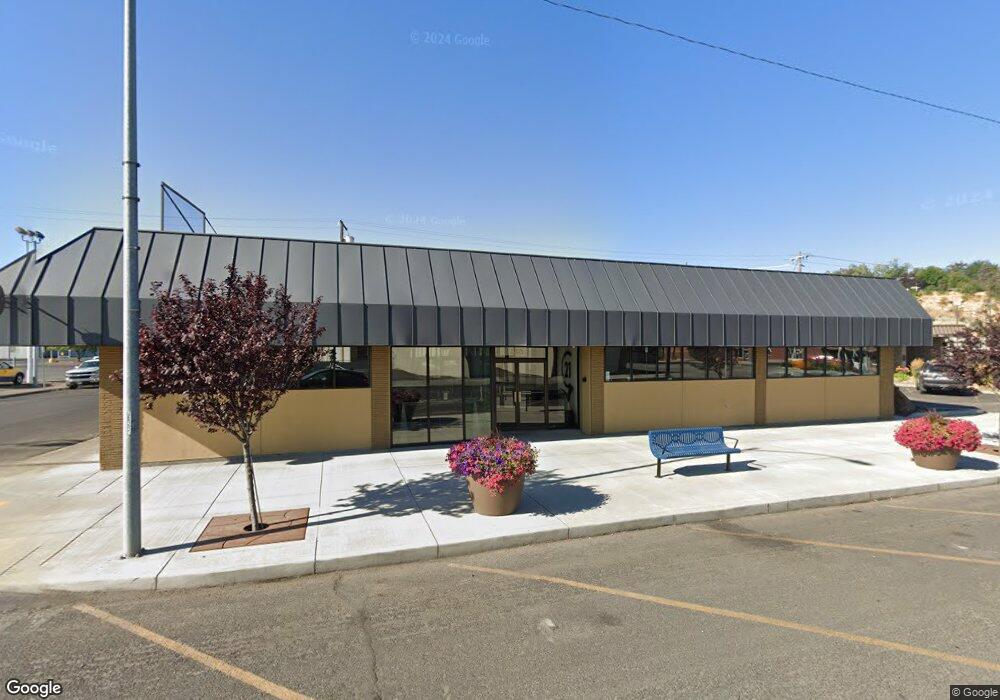
920 Main St Lewiston, ID 83501
Estimated Value: $488,000 - $899,000
Studio
1
Bath
7,049
Sq Ft
$100/Sq Ft
Est. Value
About This Home
This home is located at 920 Main St, Lewiston, ID 83501 and is currently estimated at $702,013, approximately $99 per square foot. 920 Main St is a home located in Nez Perce County with nearby schools including Webster Elementary School, Lewiston High School, and All Saints Catholic School.
Ownership History
Date
Name
Owned For
Owner Type
Purchase Details
Closed on
Aug 27, 2019
Sold by
Flow Structures Llc
Bought by
Price Right Investments Llc
Current Estimated Value
Home Financials for this Owner
Home Financials are based on the most recent Mortgage that was taken out on this home.
Original Mortgage
$532,875
Outstanding Balance
$355,198
Interest Rate
3.8%
Mortgage Type
Future Advance Clause Open End Mortgage
Estimated Equity
$346,815
Purchase Details
Closed on
Aug 20, 2007
Sold by
Sterling Savings Bank
Bought by
Lewiston C21 Llc
Home Financials for this Owner
Home Financials are based on the most recent Mortgage that was taken out on this home.
Original Mortgage
$600,000
Interest Rate
6.62%
Mortgage Type
Commercial
Create a Home Valuation Report for This Property
The Home Valuation Report is an in-depth analysis detailing your home's value as well as a comparison with similar homes in the area
Purchase History
| Date | Buyer | Sale Price | Title Company |
|---|---|---|---|
| Price Right Investments Llc | -- | Land Ttl Of Nez Perce Count | |
| Lewiston C21 Llc | -- | -- |
Source: Public Records
Mortgage History
| Date | Status | Borrower | Loan Amount |
|---|---|---|---|
| Open | Price Right Investments Llc | $532,875 | |
| Previous Owner | Lewiston C21 Llc | $600,000 |
Source: Public Records
Tax History
| Year | Tax Paid | Tax Assessment Tax Assessment Total Assessment is a certain percentage of the fair market value that is determined by local assessors to be the total taxable value of land and additions on the property. | Land | Improvement |
|---|---|---|---|---|
| 2025 | $11,532 | $815,749 | $85,649 | $730,100 |
| 2024 | $108 | $710,715 | $78,715 | $632,000 |
| 2023 | $10,903 | $710,474 | $71,374 | $639,100 |
| 2022 | $10,786 | $641,293 | $61,993 | $579,300 |
| 2021 | $11,769 | $597,583 | $56,283 | $541,300 |
| 2020 | $11,195 | $566,542 | $48,942 | $517,600 |
| 2019 | $12,278 | $566,542 | $48,942 | $517,600 |
| 2018 | $12,380 | $566,542 | $48,942 | $517,600 |
| 2017 | $10,029 | $0 | $0 | $0 |
| 2016 | $10,029 | $0 | $0 | $0 |
| 2015 | $9,971 | $0 | $0 | $0 |
| 2014 | $9,855 | $498,240 | $48,240 | $450,000 |
Source: Public Records
Map
Nearby Homes
Your Personal Tour Guide
Ask me questions while you tour the home.