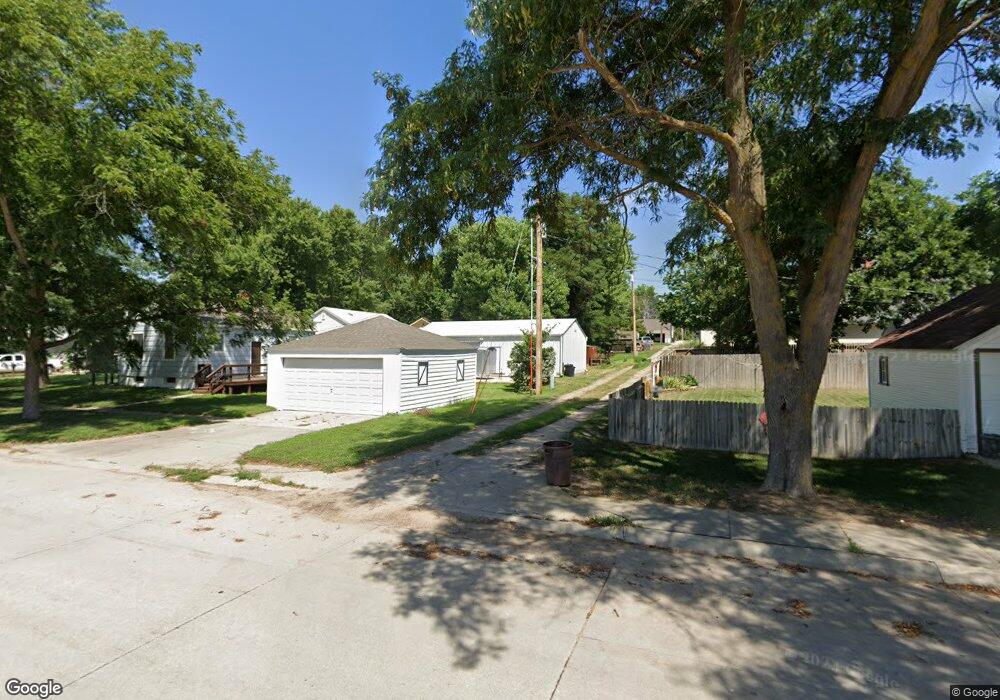
920 N 12th Ave Broken Bow, NE 68822
Estimated Value: $103,000 - $161,000
--
Bed
--
Bath
644
Sq Ft
$189/Sq Ft
Est. Value
About This Home
This home is located at 920 N 12th Ave, Broken Bow, NE 68822 and is currently estimated at $121,577, approximately $188 per square foot. 920 N 12th Ave is a home located in Custer County with nearby schools including North Park Elementary School, Broken Bow Junior High School, and Broken Bow High School.
Ownership History
Date
Name
Owned For
Owner Type
Purchase Details
Closed on
May 1, 2025
Sold by
Denney Stephen
Bought by
Leibhart Randy D
Current Estimated Value
Purchase Details
Closed on
Jun 17, 2016
Sold by
Ryan Winberg and Ryan Teresa
Bought by
Denney Stephen G and Denney Emma M
Purchase Details
Closed on
Jun 30, 2011
Sold by
Douglass Bridget E
Bought by
Winberg Ryan and Winberg Teresa
Purchase Details
Closed on
Mar 19, 2008
Sold by
Farmer Rex and Farmer Melissa
Bought by
Douglass Bridget E
Create a Home Valuation Report for This Property
The Home Valuation Report is an in-depth analysis detailing your home's value as well as a comparison with similar homes in the area
Home Values in the Area
Average Home Value in this Area
Purchase History
| Date | Buyer | Sale Price | Title Company |
|---|---|---|---|
| Leibhart Randy D | $110,000 | Russell Title & Escrow Co | |
| Denney Stephen G | $75,000 | -- | |
| Winberg Ryan | $65,000 | -- | |
| Douglass Bridget E | $50,000 | -- |
Source: Public Records
Tax History Compared to Growth
Tax History
| Year | Tax Paid | Tax Assessment Tax Assessment Total Assessment is a certain percentage of the fair market value that is determined by local assessors to be the total taxable value of land and additions on the property. | Land | Improvement |
|---|---|---|---|---|
| 2025 | $1,091 | $93,620 | $8,602 | $85,018 |
| 2024 | $1,091 | $81,033 | $8,602 | $72,431 |
| 2023 | $1,279 | $81,645 | $8,602 | $73,043 |
| 2022 | $1,349 | $73,531 | $8,602 | $64,929 |
| 2021 | $1,309 | $72,993 | $8,064 | $64,929 |
| 2020 | $1,298 | $72,993 | $8,064 | $64,929 |
| 2019 | $1,236 | $69,624 | $4,032 | $65,592 |
| 2017 | $1,225 | $67,054 | $4,032 | $63,022 |
| 2016 | $1,312 | $65,656 | $2,634 | $63,022 |
| 2015 | $1,267 | $62,890 | $2,602 | $60,288 |
| 2014 | $1,267 | $57,172 | $2,365 | $54,807 |
Source: Public Records
Map
Nearby Homes