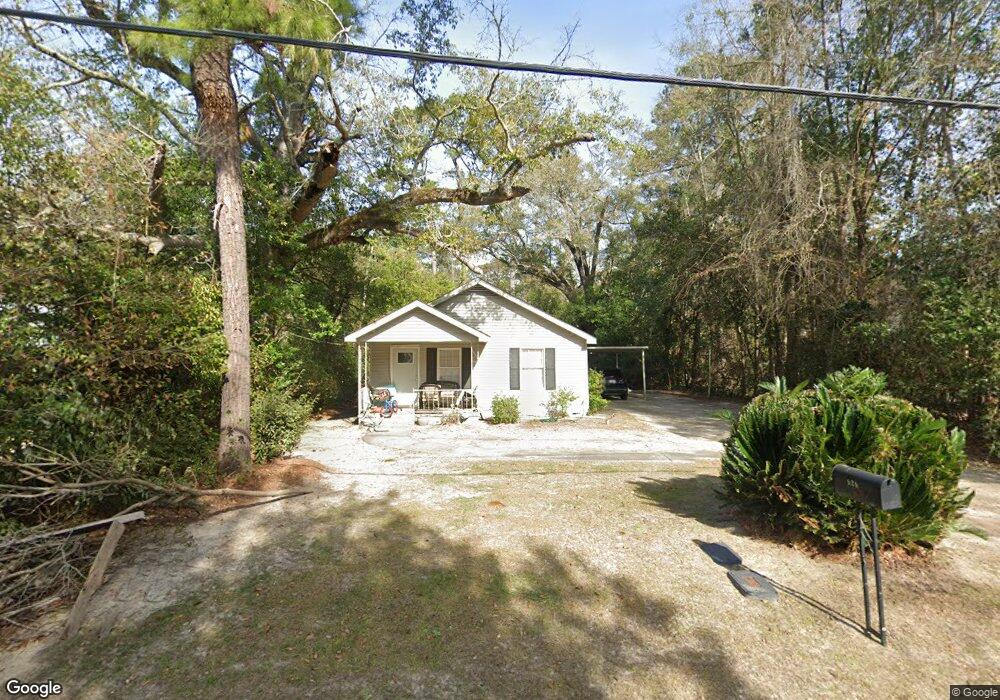
920 N Hansell St Thomasville, GA 31792
Estimated Value: $94,000 - $153,000
3
Beds
1
Bath
1,120
Sq Ft
$115/Sq Ft
Est. Value
About This Home
This home is located at 920 N Hansell St, Thomasville, GA 31792 and is currently estimated at $128,655, approximately $114 per square foot. 920 N Hansell St is a home located in Thomas County with nearby schools including Thomasville High School, Thomasville Christian School, and World of Truth Christian Academy.
Ownership History
Date
Name
Owned For
Owner Type
Purchase Details
Closed on
Sep 18, 2006
Sold by
Brents Ashley
Bought by
Cole Farrah
Current Estimated Value
Home Financials for this Owner
Home Financials are based on the most recent Mortgage that was taken out on this home.
Original Mortgage
$55,084
Outstanding Balance
$32,518
Interest Rate
6.36%
Mortgage Type
FHA
Estimated Equity
$96,137
Purchase Details
Closed on
Jan 12, 2006
Sold by
Parrish Thomas W
Bought by
Brents Ashley and Brents Brandon L
Home Financials for this Owner
Home Financials are based on the most recent Mortgage that was taken out on this home.
Original Mortgage
$37,401
Interest Rate
6.21%
Mortgage Type
New Conventional
Purchase Details
Closed on
Nov 18, 2004
Sold by
Tcf National Bank Minnesota
Bought by
Parrish Thomas W
Purchase Details
Closed on
Oct 5, 2004
Sold by
Hill Jerome and Hill Ada
Bought by
Tcf National Bank Minnesota
Purchase Details
Closed on
Jul 21, 1988
Bought by
Hill Jerome and Hill Ada
Create a Home Valuation Report for This Property
The Home Valuation Report is an in-depth analysis detailing your home's value as well as a comparison with similar homes in the area
Home Values in the Area
Average Home Value in this Area
Purchase History
| Date | Buyer | Sale Price | Title Company |
|---|---|---|---|
| Cole Farrah | $59,000 | -- | |
| Brents Ashley | $31,500 | -- | |
| Parrish Thomas W | $23,000 | -- | |
| Tcf National Bank Minnesota | -- | -- | |
| Hill Jerome | -- | -- |
Source: Public Records
Mortgage History
| Date | Status | Borrower | Loan Amount |
|---|---|---|---|
| Open | Cole Farrah | $55,084 | |
| Closed | Cole Farrah | $7,500 | |
| Previous Owner | Brents Ashley | $37,401 |
Source: Public Records
Tax History Compared to Growth
Tax History
| Year | Tax Paid | Tax Assessment Tax Assessment Total Assessment is a certain percentage of the fair market value that is determined by local assessors to be the total taxable value of land and additions on the property. | Land | Improvement |
|---|---|---|---|---|
| 2024 | $752 | $31,727 | $7,573 | $24,154 |
| 2023 | $736 | $30,330 | $7,573 | $22,757 |
| 2022 | $228 | $26,063 | $6,585 | $19,478 |
| 2021 | $219 | $22,925 | $6,585 | $16,340 |
| 2020 | $223 | $22,845 | $6,585 | $16,260 |
| 2019 | $225 | $22,845 | $6,585 | $16,260 |
| 2018 | $226 | $22,729 | $6,585 | $16,144 |
| 2017 | $207 | $20,535 | $5,426 | $15,109 |
| 2016 | $205 | $20,368 | $5,426 | $14,942 |
| 2015 | $219 | $21,391 | $5,061 | $16,330 |
| 2014 | $213 | $20,721 | $5,061 | $15,660 |
| 2013 | -- | $20,721 | $5,060 | $15,660 |
Source: Public Records
Map
Nearby Homes
- 0.73ACR Edgewood Circle (Parcel 003 014015)
- 415 Edgewood Cir
- 707 E Calhoun St
- 701 E Calhoun St
- 622 Marshall St
- 1511 N Dawson St
- 1102 N Young St
- 1307 N Dawson St
- 707 E Monroe St
- 711 E Monroe St
- 119 E Merrill St
- 207 Maury St
- 710 Marshall St
- 526 N Crawford St
- 1101 N Crawford St
- 107 Roundcrest Dr
- 523 E Washington St
- 415 N Crawford St
- 822 N Stevens St
- 308 Fontaine Dr
- 918 N Hansell St
- 922 N Hansell St
- 916 N Hansell St
- 924 N Hansell St
- 931 N Spair St
- 914 N Hansell St
- 935 N Spair St
- 937 N Spair St
- 929 N Hansell St
- 925 N Hansell St
- 927 N Hansell St
- 927 N Spair St
- 933 N Spair St
- 608 E Walcott St
- 912 N Hansell St
- 923 N Hansell St
- 606 E Walcott St
- 520 E Walcott St
- 917 N Hansell St
- 612 E Walcott St