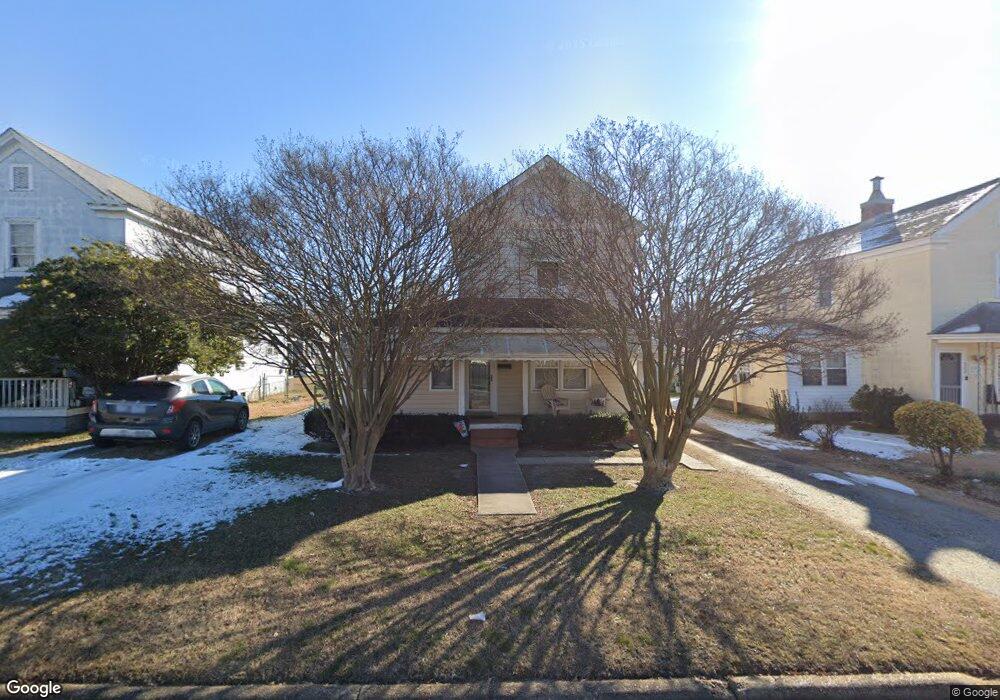
920 Rapids St Roanoke Rapids, NC 27870
Estimated Value: $134,256 - $168,000
2
Beds
2
Baths
1,556
Sq Ft
$97/Sq Ft
Est. Value
About This Home
This home is located at 920 Rapids St, Roanoke Rapids, NC 27870 and is currently estimated at $150,564, approximately $96 per square foot. 920 Rapids St is a home located in Halifax County with nearby schools including Roanoke Rapids High School and Victory Christian Academy.
Ownership History
Date
Name
Owned For
Owner Type
Purchase Details
Closed on
Jan 7, 2016
Sold by
Fishel Patricia N and Coons Patricia N
Bought by
Coons Patricia N
Current Estimated Value
Home Financials for this Owner
Home Financials are based on the most recent Mortgage that was taken out on this home.
Original Mortgage
$57,375
Outstanding Balance
$24,403
Interest Rate
3.98%
Mortgage Type
New Conventional
Estimated Equity
$126,161
Purchase Details
Closed on
May 6, 1996
Bought by
Rook Patricia Fishel
Create a Home Valuation Report for This Property
The Home Valuation Report is an in-depth analysis detailing your home's value as well as a comparison with similar homes in the area
Purchase History
| Date | Buyer | Sale Price | Title Company |
|---|---|---|---|
| Coons Patricia N | -- | None Available | |
| Rook Patricia Fishel | $36,000 | -- |
Source: Public Records
Mortgage History
| Date | Status | Borrower | Loan Amount |
|---|---|---|---|
| Open | Coons Patricia N | $57,375 |
Source: Public Records
Tax History
| Year | Tax Paid | Tax Assessment Tax Assessment Total Assessment is a certain percentage of the fair market value that is determined by local assessors to be the total taxable value of land and additions on the property. | Land | Improvement |
|---|---|---|---|---|
| 2025 | $18 | $99,400 | $3,600 | $95,800 |
| 2024 | $18 | $99,400 | $3,600 | $95,800 |
| 2023 | $1,504 | $73,200 | $3,600 | $69,600 |
| 2022 | $1,511 | $73,200 | $3,600 | $69,600 |
| 2021 | $1,454 | $73,200 | $3,600 | $69,600 |
| 2020 | $1,453 | $73,200 | $3,600 | $69,600 |
| 2019 | $1,555 | $78,500 | $5,700 | $72,800 |
| 2018 | $1,520 | $78,500 | $5,700 | $72,800 |
| 2017 | $1,514 | $78,500 | $5,700 | $72,800 |
| 2016 | $1,564 | $78,500 | $5,700 | $72,800 |
| 2015 | $1,493 | $78,500 | $5,700 | $72,800 |
| 2014 | $1,424 | $77,810 | $7,180 | $70,630 |
Source: Public Records
Map
Nearby Homes
- 817 Vance St
- 909 Monroe St
- 700 Vance St
- 638 Rapids St
- 808 Monroe St
- 2077, 91 W 10th St
- 900 Ransome St
- 2124 N Carolina 48
- 1316 Bolling Rd
- 823 W 5th St
- 1206 Hamilton St
- 1226 Hamilton St
- 1033 Jefferson St
- 112 E 7th St
- 414 Monroe St
- 340 Rapids St
- 1511 Dogwood St
- 525 Hamilton St
- 638 A B Jefferson St
- 410 Madison St
Your Personal Tour Guide
Ask me questions while you tour the home.