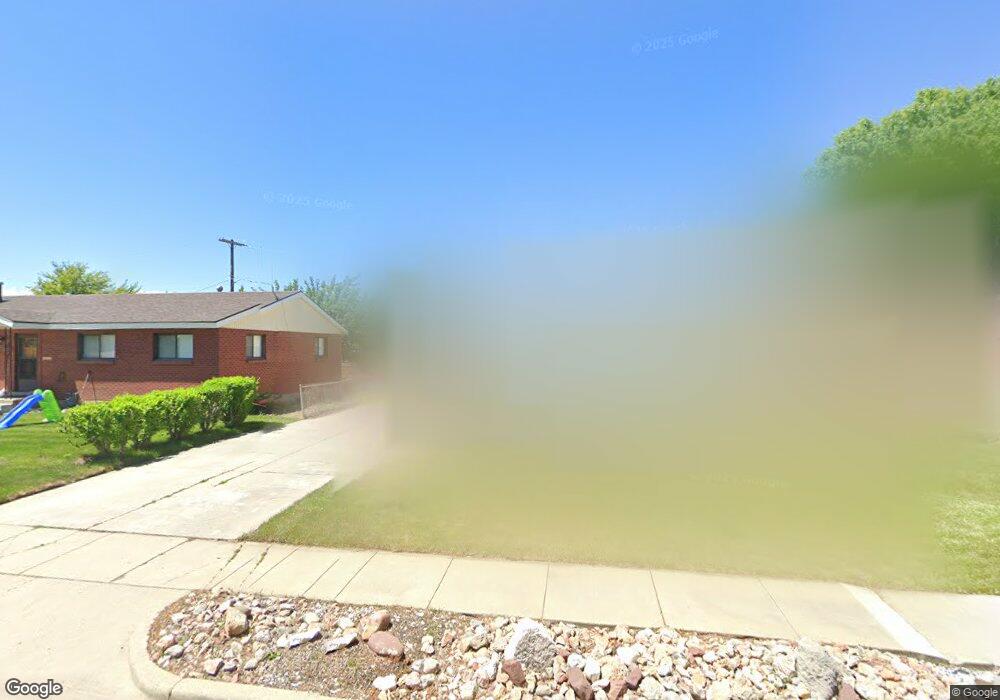
920 S 400 W Bountiful, UT 84010
Estimated Value: $512,000 - $583,000
4
Beds
2
Baths
2,327
Sq Ft
$233/Sq Ft
Est. Value
About This Home
This home is located at 920 S 400 W, Bountiful, UT 84010 and is currently estimated at $541,203, approximately $232 per square foot. 920 S 400 W is a home located in Davis County with nearby schools including Bountiful Elementary School, Millcreek Junior High School, and Bountiful High School.
Ownership History
Date
Name
Owned For
Owner Type
Purchase Details
Closed on
Sep 13, 2021
Sold by
Cramer Chris
Bought by
Francom Tim and Francom Lok Yee
Current Estimated Value
Home Financials for this Owner
Home Financials are based on the most recent Mortgage that was taken out on this home.
Original Mortgage
$437,000
Outstanding Balance
$396,770
Interest Rate
2.8%
Mortgage Type
New Conventional
Estimated Equity
$144,433
Purchase Details
Closed on
Jul 15, 2019
Sold by
Lindgren Zeke
Bought by
Cramer Chris
Home Financials for this Owner
Home Financials are based on the most recent Mortgage that was taken out on this home.
Original Mortgage
$328,932
Interest Rate
3.5%
Mortgage Type
FHA
Purchase Details
Closed on
May 23, 2016
Sold by
Evans Russell P and Sjoberg Lynda L
Bought by
Lindgren Zeke
Create a Home Valuation Report for This Property
The Home Valuation Report is an in-depth analysis detailing your home's value as well as a comparison with similar homes in the area
Purchase History
| Date | Buyer | Sale Price | Title Company |
|---|---|---|---|
| Francom Tim | -- | National Title Agency | |
| Francom Tim | -- | National Title | |
| Cramer Chris | -- | First American Title | |
| Lindgren Zeke | -- | Mountain America Title |
Source: Public Records
Mortgage History
| Date | Status | Borrower | Loan Amount |
|---|---|---|---|
| Open | Francom Tim | $437,000 | |
| Closed | Francom Tim | $437,000 | |
| Previous Owner | Cramer Chris | $328,932 |
Source: Public Records
Tax History
| Year | Tax Paid | Tax Assessment Tax Assessment Total Assessment is a certain percentage of the fair market value that is determined by local assessors to be the total taxable value of land and additions on the property. | Land | Improvement |
|---|---|---|---|---|
| 2025 | $3,026 | $278,301 | $120,786 | $157,515 |
| 2024 | $2,832 | $270,050 | $104,705 | $165,345 |
| 2023 | $2,702 | $467,000 | $195,652 | $271,348 |
| 2022 | $2,872 | $272,800 | $107,658 | $165,142 |
| 2021 | $2,604 | $378,000 | $140,764 | $237,236 |
| 2020 | $2,292 | $334,000 | $121,260 | $212,740 |
| 2019 | $2,052 | $290,000 | $135,195 | $154,805 |
| 2018 | $1,894 | $263,000 | $132,691 | $130,309 |
| 2016 | $1,679 | $122,045 | $52,919 | $69,126 |
| 2015 | $1,577 | $111,815 | $52,919 | $58,896 |
| 2014 | $1,487 | $108,112 | $52,919 | $55,193 |
| 2013 | -- | $100,964 | $36,190 | $64,774 |
Source: Public Records
Map
Nearby Homes
- 1016 S 400 W
- 990 S 500 W
- 1314 S 200 W Unit 19
- 650 S Main St Unit 6206
- 650 S Main St Unit 9106
- 734 W 1300 S Unit W
- 758 W 1000 S
- 190 W 1800 S
- 1601 S 700 W
- 34 W 400 S
- 32 W 400 S
- 1940 S 200 W Unit 3
- 1950 S 200 W Unit 32
- 545 S 100 E
- 1820 S 50 W
- 2095 S Main St Unit 13
- 141 E 1650 S
- 357 S 100 E
- 75 N Peregrine Ln W Unit 8
- 285 E 1100 S
Your Personal Tour Guide
Ask me questions while you tour the home.