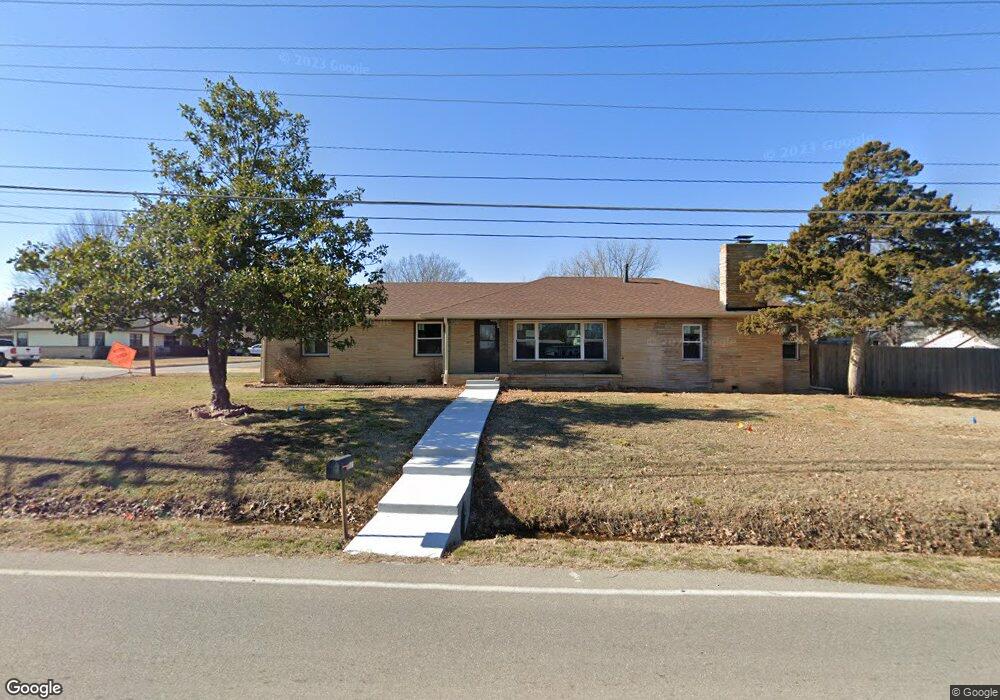
920 S Osage Ave Skiatook, OK 74070
Estimated Value: $129,000 - $168,000
4
Beds
2
Baths
1,632
Sq Ft
$89/Sq Ft
Est. Value
About This Home
This home is located at 920 S Osage Ave, Skiatook, OK 74070 and is currently estimated at $145,667, approximately $89 per square foot. 920 S Osage Ave is a home located in Osage County with nearby schools including Marrs Elementary School, Newman Middle School, and Skiatook High School.
Ownership History
Date
Name
Owned For
Owner Type
Purchase Details
Closed on
Dec 14, 2021
Sold by
Coffman Amy D
Bought by
Blaylock Russ and Blaylock Shannon
Current Estimated Value
Home Financials for this Owner
Home Financials are based on the most recent Mortgage that was taken out on this home.
Original Mortgage
$80,000
Outstanding Balance
$73,255
Interest Rate
3.09%
Mortgage Type
Commercial
Estimated Equity
$72,412
Purchase Details
Closed on
May 9, 2005
Sold by
Morgan Gary E and Morgan Peggy S
Bought by
Coffman Amy Dawn and Coffman Curtis James
Home Financials for this Owner
Home Financials are based on the most recent Mortgage that was taken out on this home.
Original Mortgage
$70,400
Interest Rate
7.87%
Mortgage Type
Adjustable Rate Mortgage/ARM
Purchase Details
Closed on
Jan 29, 2002
Sold by
Peskov Victor and Nataliya H-W
Bought by
Morgan Gary E and Morgan Peggy S
Purchase Details
Closed on
Jan 22, 1999
Sold by
Perkins Ellison E and Perkins Lynn
Bought by
Peskov Victor and Nataliya H-W
Create a Home Valuation Report for This Property
The Home Valuation Report is an in-depth analysis detailing your home's value as well as a comparison with similar homes in the area
Home Values in the Area
Average Home Value in this Area
Purchase History
| Date | Buyer | Sale Price | Title Company |
|---|---|---|---|
| Blaylock Russ | $100,000 | Investors Title & Escrow Co | |
| Coffman Amy Dawn | -- | -- | |
| Morgan Gary E | $69,000 | -- | |
| Peskov Victor | $55,500 | -- |
Source: Public Records
Mortgage History
| Date | Status | Borrower | Loan Amount |
|---|---|---|---|
| Open | Blaylock Russ | $80,000 | |
| Previous Owner | Coffman Amy Dawn | $70,400 |
Source: Public Records
Tax History Compared to Growth
Tax History
| Year | Tax Paid | Tax Assessment Tax Assessment Total Assessment is a certain percentage of the fair market value that is determined by local assessors to be the total taxable value of land and additions on the property. | Land | Improvement |
|---|---|---|---|---|
| 2025 | $1,244 | $16,683 | $1,418 | $15,265 |
| 2024 | $1,244 | $12,459 | $1,350 | $11,109 |
| 2023 | $1,244 | $12,459 | $1,350 | $11,109 |
| 2022 | $1,234 | $12,459 | $1,350 | $11,109 |
| 2021 | $1,238 | $12,459 | $1,350 | $11,109 |
| 2020 | $1,246 | $12,459 | $1,350 | $11,109 |
| 2019 | $1,261 | $12,459 | $1,350 | $11,109 |
| 2018 | $1,256 | $12,459 | $1,350 | $11,109 |
| 2017 | $1,262 | $12,341 | $1,350 | $10,991 |
| 2016 | $1,207 | $11,754 | $1,350 | $10,404 |
| 2015 | $1,192 | $11,697 | $1,350 | $10,347 |
| 2014 | $1,133 | $11,701 | $1,350 | $10,351 |
| 2013 | $1,142 | $11,785 | $1,350 | $10,435 |
Source: Public Records
Map
Nearby Homes
- 14 W Chestnut St
- 133 W Chestnut Place
- 116 W Dogwood St
- 724 S Haynie St
- 615 S Haynie St
- 1122 S Russell St
- 1127 S Russell St
- 305 E Elm St
- 534 S Osage St
- 312 E Elm St
- 0 E Maple St
- 411 Pine Ave
- 001 4th St
- 002 4th St
- 209 W 3rd St
- 143 E 136th St N
- 106 S A St Unit 11
- 106 S A St Unit 3
- 1001 County Road 2265
- 715 W 4th St