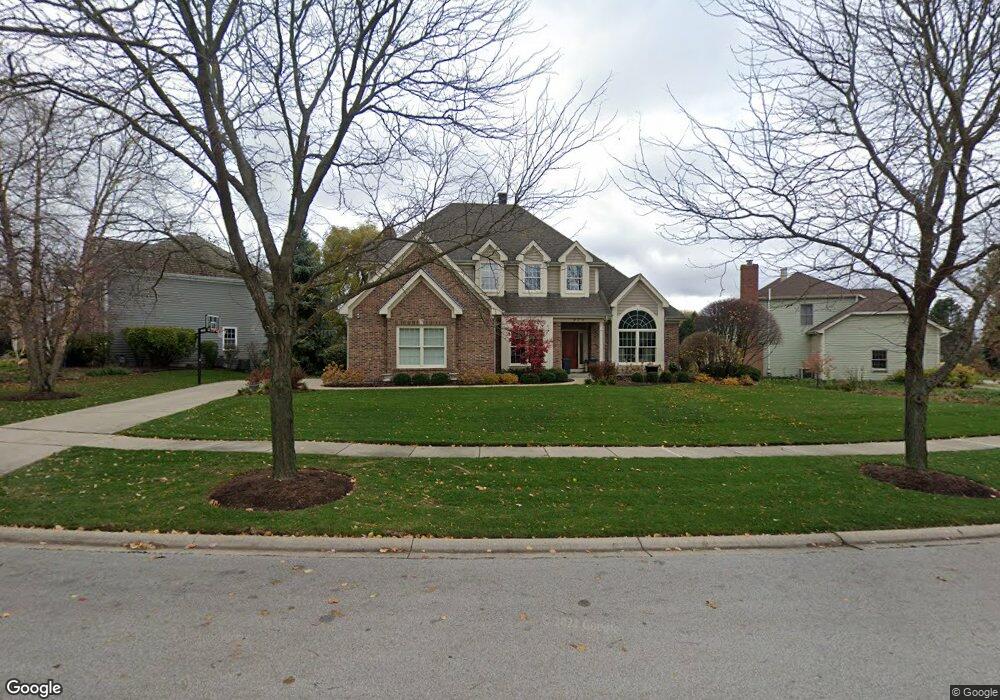
920 Saint Andrews Cir Geneva, IL 60134
Eagle Brook NeighborhoodEstimated Value: $733,000 - $790,000
4
Beds
3
Baths
3,071
Sq Ft
$244/Sq Ft
Est. Value
About This Home
This home is located at 920 Saint Andrews Cir, Geneva, IL 60134 and is currently estimated at $750,723, approximately $244 per square foot. 920 Saint Andrews Cir is a home located in Kane County with nearby schools including Western Avenue Elementary School, Geneva Community High School, and St. Peter School.
Ownership History
Date
Name
Owned For
Owner Type
Purchase Details
Closed on
Dec 16, 2020
Sold by
Sylvester Thomas R and Allen Virginia K
Bought by
Sylvester Thomas R and Sylvester Virginia A
Current Estimated Value
Home Financials for this Owner
Home Financials are based on the most recent Mortgage that was taken out on this home.
Original Mortgage
$196,300
Outstanding Balance
$142,494
Interest Rate
2.7%
Mortgage Type
New Conventional
Estimated Equity
$608,229
Purchase Details
Closed on
Feb 21, 2020
Sold by
Sylvester Thomas R and Allen Virginia K
Bought by
Sylvester Thomas R and Sylvester Virginia A
Purchase Details
Closed on
May 20, 1996
Sold by
Feiler Michael K and Feiler Judith A
Bought by
Sylvester Thomas R and Allen Virginia K
Home Financials for this Owner
Home Financials are based on the most recent Mortgage that was taken out on this home.
Original Mortgage
$307,800
Interest Rate
7.75%
Create a Home Valuation Report for This Property
The Home Valuation Report is an in-depth analysis detailing your home's value as well as a comparison with similar homes in the area
Home Values in the Area
Average Home Value in this Area
Purchase History
| Date | Buyer | Sale Price | Title Company |
|---|---|---|---|
| Sylvester Thomas R | -- | None Available | |
| Sylvester Thomas R | -- | Attorney | |
| Sylvester Thomas R | $342,000 | -- |
Source: Public Records
Mortgage History
| Date | Status | Borrower | Loan Amount |
|---|---|---|---|
| Open | Sylvester Thomas R | $196,300 | |
| Closed | Sylvester Thomas R | $307,800 |
Source: Public Records
Tax History Compared to Growth
Tax History
| Year | Tax Paid | Tax Assessment Tax Assessment Total Assessment is a certain percentage of the fair market value that is determined by local assessors to be the total taxable value of land and additions on the property. | Land | Improvement |
|---|---|---|---|---|
| 2024 | $14,047 | $198,419 | $57,367 | $141,052 |
| 2023 | $13,569 | $180,381 | $52,152 | $128,229 |
| 2022 | $13,161 | $167,609 | $48,459 | $119,150 |
| 2021 | $12,767 | $161,380 | $46,658 | $114,722 |
| 2020 | $12,618 | $158,917 | $45,946 | $112,971 |
| 2019 | $13,012 | $155,908 | $45,076 | $110,832 |
| 2018 | $12,992 | $155,908 | $45,076 | $110,832 |
| 2017 | $12,851 | $151,750 | $43,874 | $107,876 |
| 2016 | $12,917 | $149,699 | $43,281 | $106,418 |
| 2015 | -- | $145,658 | $41,149 | $104,509 |
| 2014 | -- | $132,647 | $41,149 | $91,498 |
| 2013 | -- | $132,647 | $41,149 | $91,498 |
Source: Public Records
Map
Nearby Homes
- 2147 Fargo Blvd
- 839 S Randall Rd
- 1417 Sherwood Ln
- 1736 Kaneville Rd
- 1580 Turnberry Ct
- 1437 Cooper Ln
- 106 Bridgeport Ln
- 1530 Kaneville Rd
- 51 Burgess Rd
- 2694 Berkshire Dr Unit 8
- 2671 Stone Cir Unit 208
- 301 Country Club Place
- 2927 Caldwell Ln Unit 2
- 2692 Stone Cir Unit 203
- 2769 Stone Cir
- 2749 Stone Cir
- 2771 Stone Cir
- 2753 Stone Cir
- 2767 Stone Cir
- 2747 Stone Cir
- 904 Saint Andrews Cir
- 1063 Saint Andrews Cir
- 940 Saint Andrews Cir
- 1055 Saint Andrews Cir
- 913 Saint Andrews Cir
- 931 Saint Andrews Cir
- 907 Saint Andrews Cir
- 925 Saint Andrews Cir
- 937 Saint Andrews Cir
- 903 Saint Andrews Cir
- 919 Saint Andrews Cir
- 952 Saint Andrews Cir
- 943 Saint Andrews Cir
- 1047 Saint Andrews Cir
- 1074 Saint Andrews Cir
- 1058 Saint Andrews Cir
- 949 Saint Andrews Cir
- 958 Saint Andrews Cir
- 1050 Saint Andrews Cir
- 2154 Fargo Blvd