Estimated Value: $380,403 - $430,000
3
Beds
2
Baths
2,152
Sq Ft
$192/Sq Ft
Est. Value
About This Home
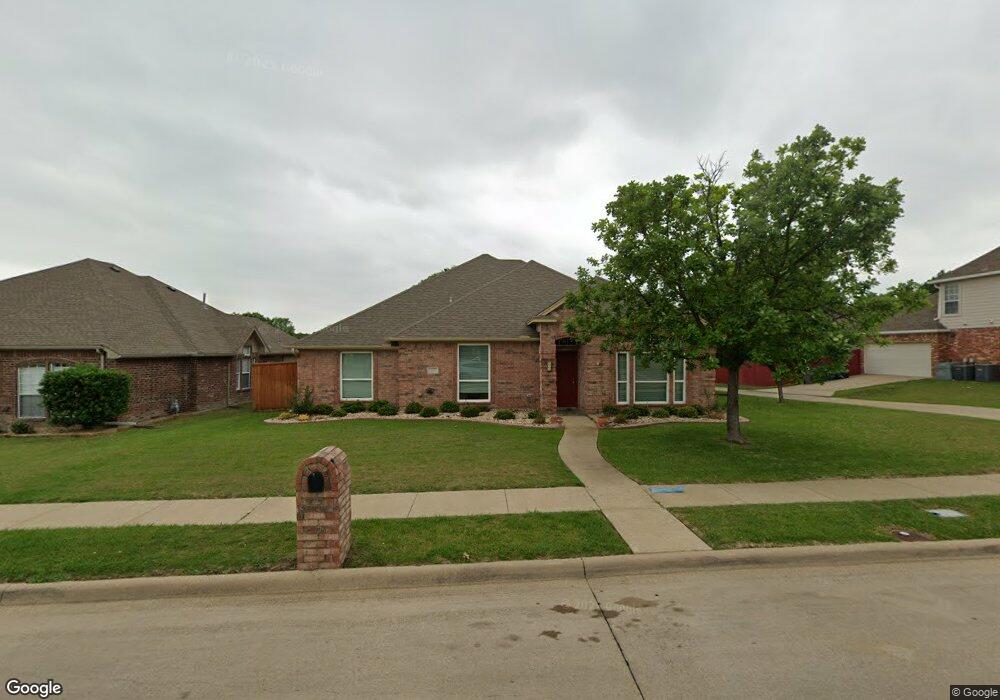
This home is located at 920 Springwood Ln, Wylie, TX 75098 and is currently estimated at $413,101, approximately $191 per square foot. 920 Springwood Ln is a home located in Collin County with nearby schools including P M Akin Elementary School, AB Harrison Intermediate School, and Grady Burnett J High School.
Ownership History
Date
Name
Owned For
Owner Type
Purchase Details
Closed on
Dec 21, 2007
Sold by
Braun John C and Braun Nikki
Bought by
Snider Ken B and Snider Marcia
Current Estimated Value
Purchase Details
Closed on
Jan 22, 1999
Sold by
Pacific Construction Inc
Bought by
Braun John C
Home Financials for this Owner
Home Financials are based on the most recent Mortgage that was taken out on this home.
Original Mortgage
$103,000
Interest Rate
6.68%
Purchase Details
Closed on
Jun 29, 1998
Sold by
Nance Richard and Nance June
Bought by
Pacific Construction Inc and Lexington Homes
Home Financials for this Owner
Home Financials are based on the most recent Mortgage that was taken out on this home.
Original Mortgage
$103,036
Interest Rate
7.08%
Create a Home Valuation Report for This Property
The Home Valuation Report is an in-depth analysis detailing your home's value as well as a comparison with similar homes in the area
Home Values in the Area
Average Home Value in this Area
Purchase History
| Date | Buyer | Sale Price | Title Company |
|---|---|---|---|
| Snider Ken B | -- | Ct | |
| Braun John C | -- | -- | |
| Pacific Construction Inc | -- | Commonwealth Land Title Co |
Source: Public Records
Mortgage History
| Date | Status | Borrower | Loan Amount |
|---|---|---|---|
| Previous Owner | Braun John C | $103,000 | |
| Previous Owner | Pacific Construction Inc | $103,036 |
Source: Public Records
Tax History Compared to Growth
Tax History
| Year | Tax Paid | Tax Assessment Tax Assessment Total Assessment is a certain percentage of the fair market value that is determined by local assessors to be the total taxable value of land and additions on the property. | Land | Improvement |
|---|---|---|---|---|
| 2025 | $1,687 | $365,247 | $104,500 | $271,023 |
| 2024 | $1,687 | $332,043 | $104,500 | $289,276 |
| 2023 | $1,687 | $301,857 | $95,000 | $282,131 |
| 2022 | $6,020 | $274,415 | $80,750 | $235,679 |
| 2021 | $5,870 | $249,468 | $43,700 | $205,768 |
| 2020 | $6,262 | $252,205 | $43,700 | $208,505 |
| 2019 | $6,239 | $237,428 | $43,700 | $209,727 |
| 2018 | $5,813 | $215,844 | $43,700 | $203,207 |
| 2017 | $5,284 | $196,222 | $34,200 | $162,022 |
| 2016 | $5,030 | $194,356 | $34,200 | $160,156 |
| 2015 | $3,333 | $176,053 | $34,200 | $141,853 |
Source: Public Records
Map
Nearby Homes
- 825 Forest Edge Ln
- 409 Cedar Ridge Dr
- 306 Foxwood Ct
- 825 Foxwood Ln
- 820 Foxwood Ln
- 216 Cedar Ridge St
- 1201 E Stone Rd
- 811 Forest Edge Ln
- 1209 Surrey Cir
- 104 Rushcreek Dr
- 312 Maltese Cir
- 416 Dogwood Dr
- 1210 Iron Horse St
- 306 Woodhollow Ct
- 1056 Fairview Dr
- 304 Hawthorn Dr
- 213 N West A Allen Blvd
- 300 Woodhollow Ct
- 1320 Cedar Branch Dr
- 1115 Nighthawk Dr
- 922 Springwood Ln
- 918 Springwood Ln
- 918 Springwood Ln
- 921 Heatherwood Dr
- 924 Springwood Ln
- 923 Heatherwood Dr
- 919 Heatherwood Dr
- 925 Heatherwood Dr
- 926 Springwood Ln
- 927 Heatherwood Dr
- 412 Lanwood
- 928 Springwood Ln
- 408 Lanwood
- 929 Heatherwood Dr
- 914 Heatherwood Dr
- 924 Heatherwood Dr
- 404 Lanwood
- 930 Springwood Ln
- 920 Heatherwood Dr
- 913 Heatherwood Dr