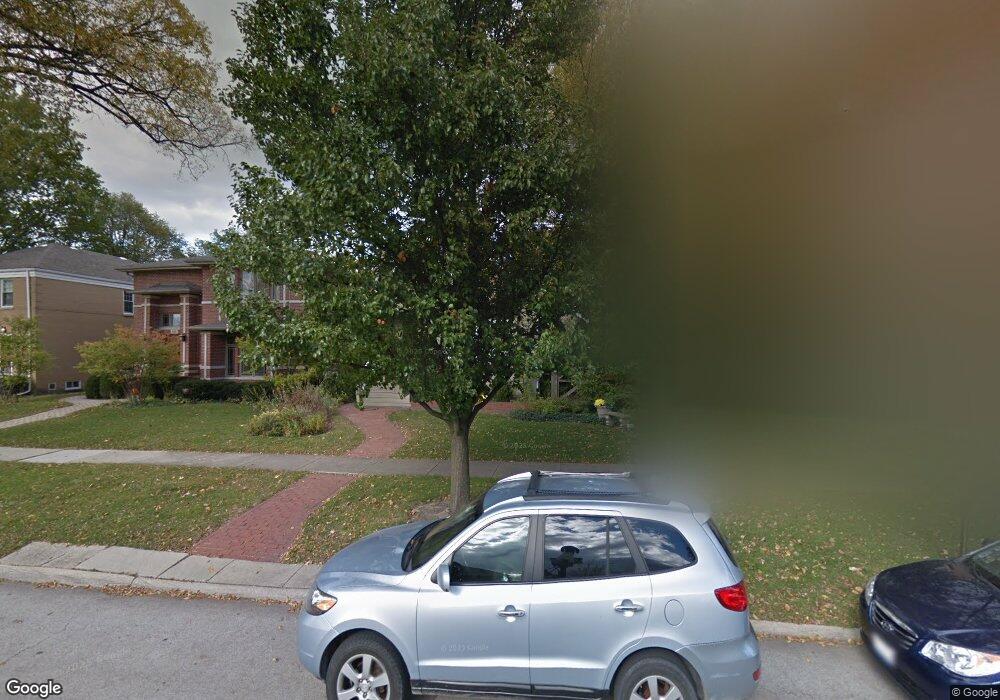
920 W Crescent Ave Park Ridge, IL 60068
Estimated Value: $921,000 - $1,035,000
4
Beds
4
Baths
2,922
Sq Ft
$336/Sq Ft
Est. Value
About This Home
This home is located at 920 W Crescent Ave, Park Ridge, IL 60068 and is currently estimated at $981,863, approximately $336 per square foot. 920 W Crescent Ave is a home located in Cook County with nearby schools including George Washington Elementary School, Lincoln Middle School, and Maine South High School.
Ownership History
Date
Name
Owned For
Owner Type
Purchase Details
Closed on
Feb 11, 2011
Sold by
Lamb Patrick D and Lamb Mary K
Bought by
Lamb Mary K and Mary K Lamb Trust
Current Estimated Value
Purchase Details
Closed on
Dec 22, 2008
Sold by
Lamb Patrick D and Lamb Mary K
Bought by
Lamb Mary K and Mary K Lamb Trust
Purchase Details
Closed on
Jul 26, 2007
Sold by
Lamb Patrick D and Lamb Mary Kelly
Bought by
Lamb Patrick D and Lamb Mary Kelly
Home Financials for this Owner
Home Financials are based on the most recent Mortgage that was taken out on this home.
Original Mortgage
$250,000
Interest Rate
6.73%
Mortgage Type
New Conventional
Purchase Details
Closed on
Jul 15, 1999
Sold by
Lamb Mary K
Bought by
Lamb Patrick D and Lamb Mary K
Purchase Details
Closed on
Aug 7, 1997
Sold by
Lamb Patrick D and Lamb Mary Kelly
Bought by
Lamb Patrick D and Lamb Mary Kelly
Create a Home Valuation Report for This Property
The Home Valuation Report is an in-depth analysis detailing your home's value as well as a comparison with similar homes in the area
Home Values in the Area
Average Home Value in this Area
Purchase History
| Date | Buyer | Sale Price | Title Company |
|---|---|---|---|
| Lamb Mary K | -- | None Available | |
| Lamb Mary K | -- | Ticor Title Insurance Co | |
| Lamb Patrick D | -- | None Available | |
| Lamb Patrick D | -- | None Available | |
| Lamb Patrick D | -- | -- |
Source: Public Records
Mortgage History
| Date | Status | Borrower | Loan Amount |
|---|---|---|---|
| Closed | Lamb Patrick D | $250,000 |
Source: Public Records
Tax History Compared to Growth
Tax History
| Year | Tax Paid | Tax Assessment Tax Assessment Total Assessment is a certain percentage of the fair market value that is determined by local assessors to be the total taxable value of land and additions on the property. | Land | Improvement |
|---|---|---|---|---|
| 2024 | $17,424 | $70,167 | $12,750 | $57,417 |
| 2023 | $16,647 | $70,167 | $12,750 | $57,417 |
| 2022 | $16,647 | $70,167 | $12,750 | $57,417 |
| 2021 | $15,130 | $53,078 | $7,875 | $45,203 |
| 2020 | $14,597 | $53,078 | $7,875 | $45,203 |
| 2019 | $15,316 | $62,195 | $7,875 | $54,320 |
| 2018 | $13,784 | $51,603 | $6,750 | $44,853 |
| 2017 | $15,216 | $56,775 | $6,750 | $50,025 |
| 2016 | $14,893 | $56,775 | $6,750 | $50,025 |
| 2015 | $15,546 | $53,026 | $5,625 | $47,401 |
| 2014 | $15,256 | $53,026 | $5,625 | $47,401 |
| 2013 | $14,433 | $53,026 | $5,625 | $47,401 |
Source: Public Records
Map
Nearby Homes
- 316 S Fairview Ave
- 428 S Clifton Ave
- 301 S Prospect Ave
- 103 N Clifton Ave
- 1301 W Touhy Ave Unit 315
- 170 N Northwest Hwy Unit 410
- 170 N Northwest Hwy Unit 407
- 623 S Prospect Ave
- 249 S Vine Ave Unit B
- 812 Elm St
- 1210 Elm St
- 300 Meacham Ave
- 1228 Elm St
- 425 W Talcott Rd
- 320 Grant Place
- 421 Leonard St
- 516 Engel Blvd
- 445 N Northwest Hwy
- 919 S Chester Ave
- 819 Albion Ave
- 924 W Crescent Ave
- 918 W Crescent Ave
- 914 W Crescent Ave
- 923 Prairie Ave
- 927 Prairie Ave
- 303 S Clifton Ave
- 917 Prairie Ave
- 906 W Crescent Ave
- 1000 W Crescent Ave
- 909 Prairie Ave
- 305 S Clifton Ave
- 300 S Cumberland Ave
- 902 W Crescent Ave
- 1006 W Crescent Ave
- 1003 Prairie Ave
- 907 Prairie Ave
- 311 S Clifton Ave
- 304 S Cumberland Ave
- 1005 Prairie Ave