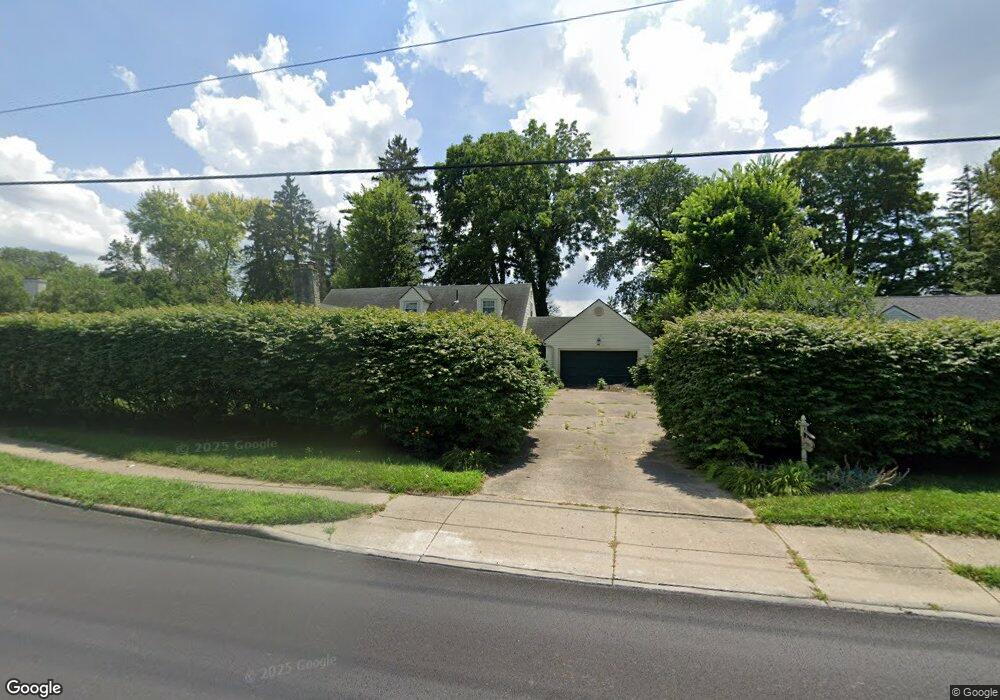
920 W Dorothy Ln Dayton, OH 45409
Estimated Value: $288,000 - $355,000
3
Beds
3
Baths
1,390
Sq Ft
$235/Sq Ft
Est. Value
About This Home
This home is located at 920 W Dorothy Ln, Dayton, OH 45409 and is currently estimated at $327,283, approximately $235 per square foot. 920 W Dorothy Ln is a home located in Montgomery County with nearby schools including Southdale Elementary School, Van Buren Middle School, and Kettering Fairmont High School.
Ownership History
Date
Name
Owned For
Owner Type
Purchase Details
Closed on
May 18, 2012
Sold by
Boshart Elizabeth F
Bought by
Boshart Elizabeth F and Elizabeth F Boshart Revocable Living Tru
Current Estimated Value
Purchase Details
Closed on
Jun 2, 2008
Sold by
Chamberlain Terry L
Bought by
Boshart Elizabeth F
Home Financials for this Owner
Home Financials are based on the most recent Mortgage that was taken out on this home.
Original Mortgage
$144,000
Outstanding Balance
$92,593
Interest Rate
6.09%
Mortgage Type
Purchase Money Mortgage
Estimated Equity
$234,690
Purchase Details
Closed on
Dec 3, 2002
Sold by
Chamberlain Terry L
Bought by
Chamberlain Terry L and Terry L Chamberlain Living Trust Agreeme
Purchase Details
Closed on
Dec 20, 1996
Sold by
Bowron Duard and Bowron Mildred
Bought by
Chamberlain Terry L and Chamberlain Debra M
Create a Home Valuation Report for This Property
The Home Valuation Report is an in-depth analysis detailing your home's value as well as a comparison with similar homes in the area
Home Values in the Area
Average Home Value in this Area
Purchase History
| Date | Buyer | Sale Price | Title Company |
|---|---|---|---|
| Boshart Elizabeth F | -- | None Available | |
| Boshart Elizabeth F | $180,000 | Attorney | |
| Chamberlain Terry L | -- | -- | |
| Chamberlain Terry L | $125,000 | -- |
Source: Public Records
Mortgage History
| Date | Status | Borrower | Loan Amount |
|---|---|---|---|
| Open | Boshart Elizabeth F | $144,000 |
Source: Public Records
Tax History Compared to Growth
Tax History
| Year | Tax Paid | Tax Assessment Tax Assessment Total Assessment is a certain percentage of the fair market value that is determined by local assessors to be the total taxable value of land and additions on the property. | Land | Improvement |
|---|---|---|---|---|
| 2024 | $5,056 | $90,770 | $20,430 | $70,340 |
| 2023 | $5,056 | $90,770 | $20,430 | $70,340 |
| 2022 | $4,434 | $65,320 | $14,700 | $50,620 |
| 2021 | $4,100 | $65,320 | $14,700 | $50,620 |
| 2020 | $4,114 | $65,320 | $14,700 | $50,620 |
| 2019 | $5,243 | $72,590 | $14,020 | $58,570 |
| 2018 | $5,271 | $72,590 | $14,020 | $58,570 |
| 2017 | $4,854 | $72,590 | $14,020 | $58,570 |
| 2016 | $4,279 | $61,600 | $14,020 | $47,580 |
| 2015 | $4,087 | $61,600 | $14,020 | $47,580 |
| 2014 | $4,087 | $61,600 | $14,020 | $47,580 |
| 2012 | -- | $56,700 | $14,000 | $42,700 |
Source: Public Records
Map
Nearby Homes
- 3101 Allendale Dr
- 1151 Brookview Ave
- 3060 Regent St
- 1129 W Dorothy Ln
- 1364 Elmdale Dr
- 1125 Laurelwood Rd
- 1424 Elmdale Dr
- 1314 Ridgeview Ave
- 3464 Southern Blvd
- 2934 Robin Rd
- 3225 Southdale Dr Unit 1
- 1554 Crescent Blvd
- 3073 Hillside Ave
- 1545 Cardington Rd
- 321 E Dorothy Ln
- 3325 Ridgeway Rd
- 2420 Ridgeway Rd
- 1536 Old Lane Ave
- 311 Parkdale St Unit 309
- 1597 Old Lane Ave
- 914 W Dorothy Ln
- 926 W Dorothy Ln
- 1117 Belvoir Ave
- 1123 Belvoir Ave
- 3001 Southern Blvd
- 3017 Southern Blvd
- 1129 Belvoir Ave
- 1107 Belvoir Ave
- 1135 Belvoir Ave
- 1120 Belvoir Ave
- 1108 Belvoir Ave
- 3000 Southern Blvd
- 3016 Southern Blvd
- 3032 Southern Blvd
- 1130 Belvoir Ave
- 3117 Southern Blvd
- 3118 Atherton Rd
- 3048 Southern Blvd
- 1143 Belvoir Ave
- 3100 Southern Blvd