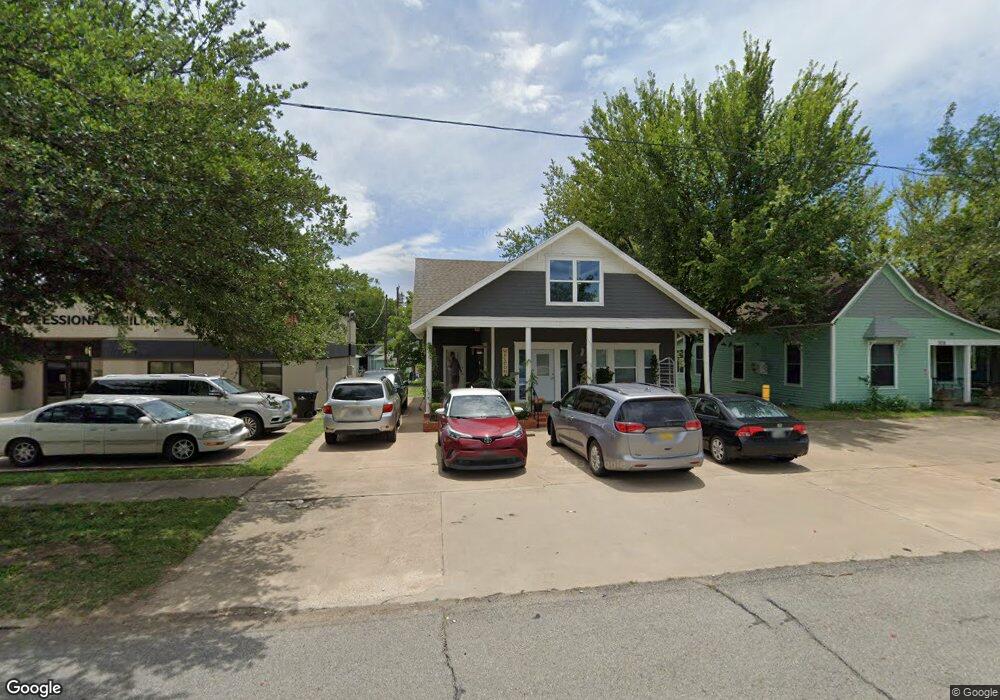
920 W Main St Denison, TX 75020
Estimated Value: $185,806 - $243,000
2
Beds
1
Bath
1,200
Sq Ft
$179/Sq Ft
Est. Value
About This Home
This home is located at 920 W Main St, Denison, TX 75020 and is currently estimated at $214,403, approximately $178 per square foot. 920 W Main St is a home located in Grayson County with nearby schools including Houston Elementary School, Scott Middle School, and Denison High School.
Ownership History
Date
Name
Owned For
Owner Type
Purchase Details
Closed on
Mar 27, 2019
Sold by
Gouge Dale R and Dusek Forrest
Bought by
Seat Llc
Current Estimated Value
Home Financials for this Owner
Home Financials are based on the most recent Mortgage that was taken out on this home.
Original Mortgage
$61,625
Outstanding Balance
$54,179
Interest Rate
4.3%
Mortgage Type
Purchase Money Mortgage
Estimated Equity
$160,224
Purchase Details
Closed on
May 31, 2018
Sold by
Hanson Wayne A
Bought by
Forgin Group Llc
Home Financials for this Owner
Home Financials are based on the most recent Mortgage that was taken out on this home.
Original Mortgage
$276,250
Interest Rate
4.4%
Purchase Details
Closed on
Nov 22, 2016
Sold by
Andrews Larry K and Andrews Micaela N
Bought by
Gouge Dale R and Dusek Forrest
Home Financials for this Owner
Home Financials are based on the most recent Mortgage that was taken out on this home.
Original Mortgage
$56,856
Interest Rate
3.47%
Mortgage Type
Commercial
Create a Home Valuation Report for This Property
The Home Valuation Report is an in-depth analysis detailing your home's value as well as a comparison with similar homes in the area
Home Values in the Area
Average Home Value in this Area
Purchase History
| Date | Buyer | Sale Price | Title Company |
|---|---|---|---|
| Seat Llc | -- | Grayson County Title | |
| Forgin Group Llc | -- | Grayson County Title | |
| Gouge Dale R | -- | Grayson County Title | |
| Gouge Dale R | -- | Grayson County Title |
Source: Public Records
Mortgage History
| Date | Status | Borrower | Loan Amount |
|---|---|---|---|
| Open | Seat Llc | $61,625 | |
| Previous Owner | Forgin Group Llc | $276,250 | |
| Previous Owner | Gouge Dale R | $56,856 |
Source: Public Records
Tax History Compared to Growth
Tax History
| Year | Tax Paid | Tax Assessment Tax Assessment Total Assessment is a certain percentage of the fair market value that is determined by local assessors to be the total taxable value of land and additions on the property. | Land | Improvement |
|---|---|---|---|---|
| 2025 | $3,516 | $151,313 | $40,200 | $111,113 |
| 2024 | $3,516 | $151,342 | $40,200 | $111,142 |
| 2023 | $3,448 | $152,184 | $36,840 | $115,344 |
| 2022 | $2,379 | $100,120 | $33,000 | $67,120 |
| 2021 | $2,525 | $100,120 | $16,500 | $83,620 |
| 2020 | $2,498 | $94,708 | $16,500 | $78,208 |
| 2019 | $2,606 | $94,708 | $16,500 | $78,208 |
| 2018 | $1,398 | $50,386 | $7,560 | $42,826 |
| 2017 | $1,424 | $50,917 | $7,560 | $43,357 |
| 2016 | $1,440 | $51,481 | $7,560 | $43,921 |
| 2015 | $0 | $69,424 | $7,560 | $61,864 |
| 2014 | -- | $70,357 | $7,560 | $62,797 |
Source: Public Records
Map
Nearby Homes
- TBD W Main St
- 1027 W Crawford St
- 826 W Crawford St
- 1109 W Crawford St
- 811 W Woodard St
- 831 W Owing St
- 1031 W Gandy St
- 720 W Gandy St
- 705 W Crawford St
- 1200 W Gandy St
- 1120 W Owing St
- 917 W Sears St
- 911 W Sears St
- 920 W Morgan St
- 627 W Chestnut St
- 829 W Sears St
- 1231 W Main St
- 1221 W Crawford St
- 108 N Eddy Ave
- 1127 W Morgan St
- 926 W Main St
- 914 W Main St
- 930 W Main St
- 923 W Chestnut St
- 919 W Chestnut St
- 929 W Chestnut St
- 908 W Main St
- 931 W Chestnut St
- 909 & 913 W Chestnut St
- 904 W Main St Unit 906
- 1000 W Main St
- 905 W Chestnut St
- 900 W Main St
- 1004 W Main St
- 1001 W Chestnut St
- 901 W Chestnut St
- 1012 W Main St
- 1008 W Main St
- 1005 W Chestnut St
- TBD-1 Scullin Ave