Estimated Value: $209,000 - $223,000
3
Beds
2
Baths
1,125
Sq Ft
$191/Sq Ft
Est. Value
About This Home
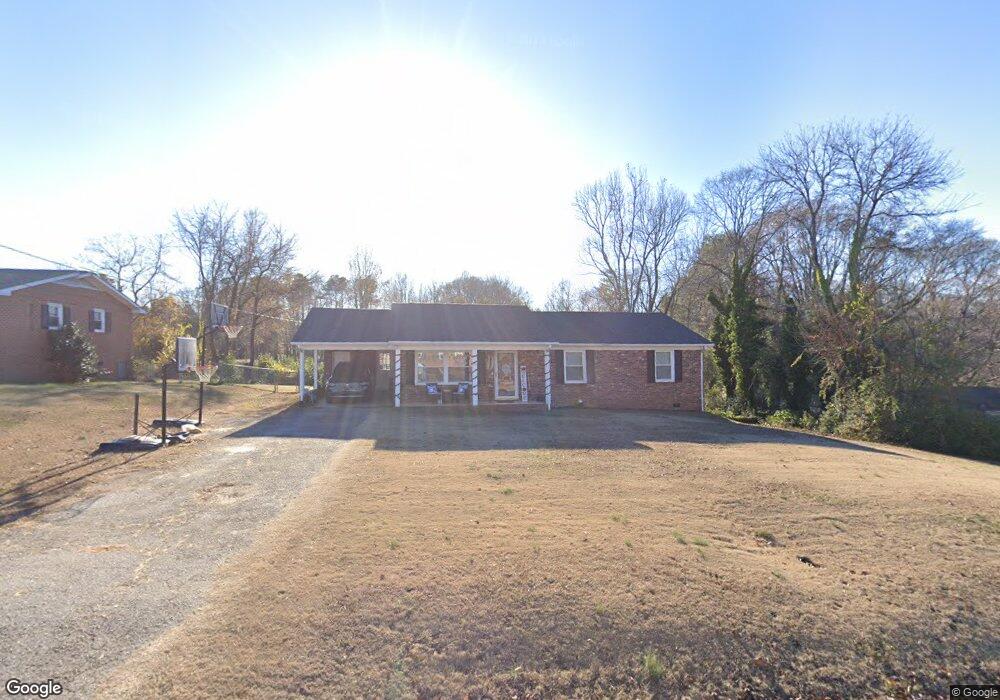
This home is located at 920 Winterhawk Cir, Inman, SC 29349 and is currently estimated at $214,897, approximately $191 per square foot. 920 Winterhawk Cir is a home located in Spartanburg County with nearby schools including Campobello-Gramling School, Chapman High School, and Inman Christian Academy.
Ownership History
Date
Name
Owned For
Owner Type
Purchase Details
Closed on
Oct 18, 2019
Sold by
Conrad Travis R and Conrad Miranda L
Bought by
Wilson Nicholas
Current Estimated Value
Home Financials for this Owner
Home Financials are based on the most recent Mortgage that was taken out on this home.
Original Mortgage
$126,262
Outstanding Balance
$111,060
Interest Rate
3.7%
Mortgage Type
New Conventional
Estimated Equity
$103,837
Purchase Details
Closed on
Jun 19, 2017
Sold by
Conrad Travis R
Bought by
Conrad Travis R and Conrad Miranda L
Home Financials for this Owner
Home Financials are based on the most recent Mortgage that was taken out on this home.
Original Mortgage
$33,000
Interest Rate
4.05%
Mortgage Type
New Conventional
Purchase Details
Closed on
Aug 20, 2013
Sold by
Estate Of Larry Ray Conrad
Bought by
Conrad Travis
Purchase Details
Closed on
Sep 19, 2011
Sold by
Estate Of Teresa Conrad
Bought by
Conrad Larry and Conrad Travis R
Create a Home Valuation Report for This Property
The Home Valuation Report is an in-depth analysis detailing your home's value as well as a comparison with similar homes in the area
Home Values in the Area
Average Home Value in this Area
Purchase History
| Date | Buyer | Sale Price | Title Company |
|---|---|---|---|
| Wilson Nicholas | $125,000 | None Available | |
| Conrad Travis R | -- | None Available | |
| Conrad Travis | -- | -- | |
| Conrad Larry | -- | -- |
Source: Public Records
Mortgage History
| Date | Status | Borrower | Loan Amount |
|---|---|---|---|
| Open | Wilson Nicholas | $126,262 | |
| Previous Owner | Conrad Travis R | $33,000 |
Source: Public Records
Tax History
| Year | Tax Paid | Tax Assessment Tax Assessment Total Assessment is a certain percentage of the fair market value that is determined by local assessors to be the total taxable value of land and additions on the property. | Land | Improvement |
|---|---|---|---|---|
| 2022 | $962 | $5,000 | $840 | $4,160 |
| 2021 | $962 | $5,000 | $840 | $4,160 |
| 2020 | $3,146 | $7,500 | $1,260 | $6,240 |
| 2019 | $566 | $2,872 | $656 | $2,216 |
| 2018 | $566 | $2,872 | $656 | $2,216 |
| 2017 | $519 | $2,568 | $656 | $1,912 |
| 2016 | $519 | $2,568 | $656 | $1,912 |
| 2015 | $506 | $2,568 | $656 | $1,912 |
| 2014 | $500 | $2,568 | $656 | $1,912 |
Source: Public Records
Map
Nearby Homes
- 200 Sneeds Dr
- 119 Beechwood Dr
- 130 Settle Dr
- 304 Shoreham Ln
- 00 State Road S-42-371
- 314 Bellrock Rd
- 318 Bellrock Rd
- 310 Bellrock Rd
- 317 Bellrock Rd
- 322 Bellrock Rd
- 329 Bellrock Rd
- 325 Bellrock Rd
- 321 Bellrock Rd
- 304 Bellrock Rd
- 221 N Main St
- 342 Carramore Dr
- 121 Hicks Dr
- 459 Gramling School Rd
- 441 Gramling School Rd
- 135 Glendarosa Dr
- 920 Winterhawk Cir
- 920 Winterhawk Cir
- 926 Winterhawk Cir
- 814 Winterhawk Cir
- 820 Winterhawk Cir
- 921 Winterhawk Cir
- 932 Winterhawk Cir
- 927 Winterhawk Cir
- 830 Winterhawk Cir
- 915 Winterhawk Cir
- 933 Winterhawk Cir
- 491 Windmill Hill Rd
- 823 Winterhawk Cir
- 817 Winterhawk Cir
- 909 Winterhawk Cir
- 829 Winterhawk Cir
- 829 Winterhawk Cir
- 902 Winterhawk Cir
- 805 Winterhawk Cir
- 511 Windmill Hill Rd
Your Personal Tour Guide
Ask me questions while you tour the home.