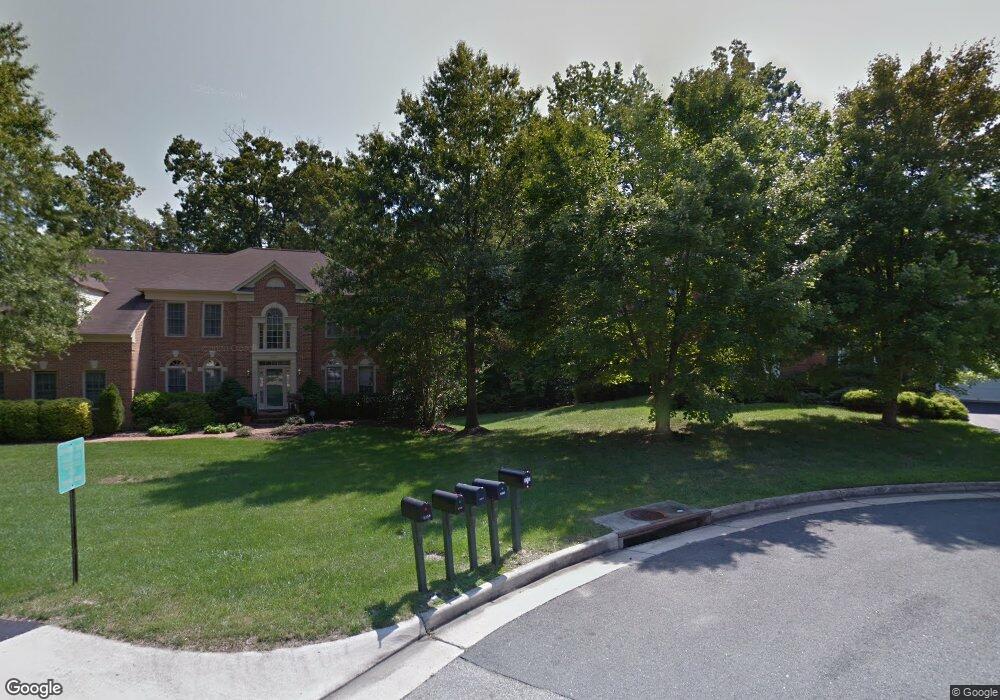
9201 Deveron Ct Fairfax Station, VA 22039
Estimated Value: $1,176,000 - $1,244,000
4
Beds
5
Baths
3,685
Sq Ft
$329/Sq Ft
Est. Value
About This Home
This home is located at 9201 Deveron Ct, Fairfax Station, VA 22039 and is currently estimated at $1,214,163, approximately $329 per square foot. 9201 Deveron Ct is a home located in Fairfax County with nearby schools including Silverbrook Elementary School, South County Middle School, and South County High School.
Ownership History
Date
Name
Owned For
Owner Type
Purchase Details
Closed on
Aug 19, 2021
Sold by
Buising Carl Louis and Buising Nori Young
Bought by
Buising Carl Louis and Buising Carl Louis
Current Estimated Value
Purchase Details
Closed on
Jul 12, 2001
Sold by
Thompson James A
Bought by
Buising Carl L
Home Financials for this Owner
Home Financials are based on the most recent Mortgage that was taken out on this home.
Original Mortgage
$463,200
Outstanding Balance
$179,284
Interest Rate
7.2%
Estimated Equity
$1,034,880
Purchase Details
Closed on
Jun 14, 1996
Sold by
Castee John R
Bought by
Thompson James A
Home Financials for this Owner
Home Financials are based on the most recent Mortgage that was taken out on this home.
Original Mortgage
$333,600
Interest Rate
7.97%
Purchase Details
Closed on
Feb 1, 1995
Sold by
Stanley Martin Companies Inc
Bought by
Sloper John R
Home Financials for this Owner
Home Financials are based on the most recent Mortgage that was taken out on this home.
Original Mortgage
$350,000
Interest Rate
9.13%
Create a Home Valuation Report for This Property
The Home Valuation Report is an in-depth analysis detailing your home's value as well as a comparison with similar homes in the area
Home Values in the Area
Average Home Value in this Area
Purchase History
| Date | Buyer | Sale Price | Title Company |
|---|---|---|---|
| Buising Carl Louis | -- | None Available | |
| Buising Carl L | $579,000 | -- | |
| Thompson James A | $417,000 | -- | |
| Sloper John R | $391,000 | -- |
Source: Public Records
Mortgage History
| Date | Status | Borrower | Loan Amount |
|---|---|---|---|
| Open | Buising Carl L | $463,200 | |
| Previous Owner | Sloper John R | $333,600 | |
| Previous Owner | Sloper John R | $350,000 | |
| Closed | Sloper John R | $41,700 |
Source: Public Records
Tax History Compared to Growth
Tax History
| Year | Tax Paid | Tax Assessment Tax Assessment Total Assessment is a certain percentage of the fair market value that is determined by local assessors to be the total taxable value of land and additions on the property. | Land | Improvement |
|---|---|---|---|---|
| 2025 | $13,023 | $1,114,310 | $405,000 | $709,310 |
| 2024 | $13,023 | $1,124,090 | $405,000 | $719,090 |
| 2023 | $12,184 | $1,079,680 | $385,000 | $694,680 |
| 2022 | $10,187 | $890,880 | $305,000 | $585,880 |
| 2021 | $9,792 | $834,420 | $280,000 | $554,420 |
| 2020 | $9,431 | $796,880 | $270,000 | $526,880 |
| 2019 | $9,431 | $796,880 | $270,000 | $526,880 |
| 2018 | $9,164 | $796,880 | $270,000 | $526,880 |
| 2017 | $8,765 | $754,990 | $265,000 | $489,990 |
| 2016 | $8,964 | $773,770 | $265,000 | $508,770 |
| 2015 | $8,412 | $753,730 | $250,000 | $503,730 |
| 2014 | $8,393 | $753,730 | $250,000 | $503,730 |
Source: Public Records
Map
Nearby Homes
- 7707 Griffin Pond Ct
- 8153 Old Barrington Blvd
- 7921 Oak Hollow Ln
- 9616 Burnt Oak Dr
- 8011 Treasure Tree Ct
- 9019 Octavia Ct
- 7411 Reservation Dr
- 8740 Cold Plain Ct
- 9712 Thorn Bush Dr
- 8906 Hooes Rd
- 8625 Oak Chase Cir
- 8852 Eagle Rock Ln
- The Grant Plan at Southern Oaks Reserve
- The Taylor Plan at Southern Oaks Reserve
- 8757 Southern Oaks Place
- 8761 Southern Oaks Place
- 7310 Glendower Ct
- 7676 Green Garland Dr
- 7101 Game Lord Dr
- 8580 Tyrolean Way
- 9200 Deveron Ct
- 9203 Deveron Ct
- 9204 Deveron Ct
- 9205 Deveron Ct
- 9206 Deveron Ct
- 9207 Deveron Ct
- 9210 Deveron Ct
- 7855 Bressingham Dr
- 7857 Bressingham Dr
- 9211 Deveron Ct
- 9209 Deveron Ct
- 7909 Bressingham Dr
- 7865 Bressingham Dr
- 9212 Deveron Ct
- 7901 Bressingham Dr
- 7907 Bressingham Dr
- 7911 Bressingham Dr
- 7853 Bressingham Dr
- 7903 Bressingham Dr
- 7905 Bressingham Dr