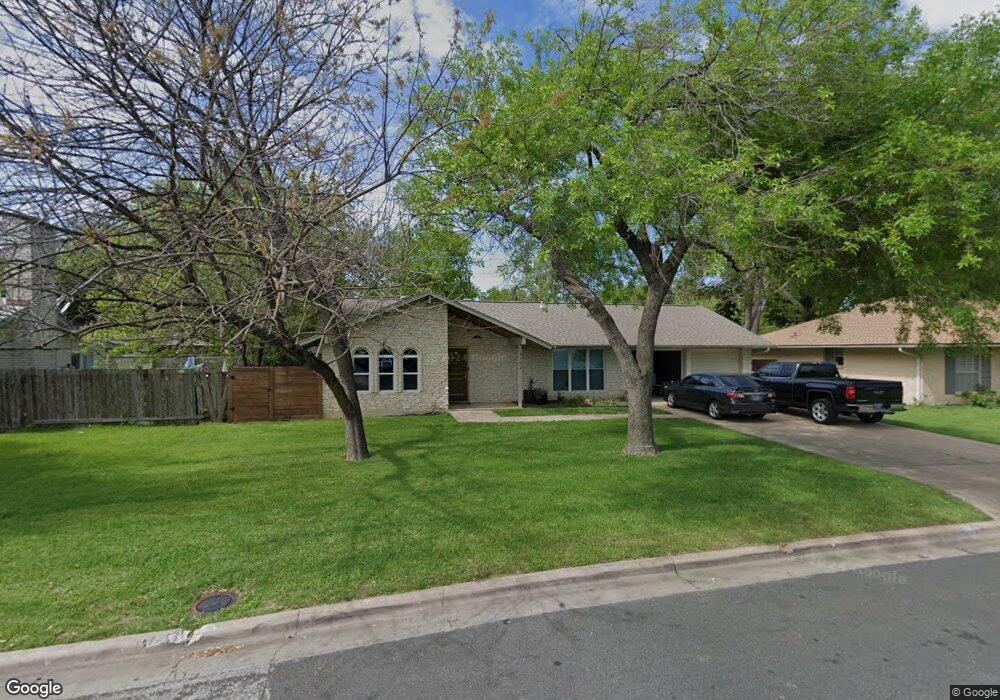
9202 Quail Cove Austin, TX 78758
North Austin NeighborhoodEstimated Value: $490,123 - $588,000
4
Beds
2
Baths
1,811
Sq Ft
$296/Sq Ft
Est. Value
About This Home
This home is located at 9202 Quail Cove, Austin, TX 78758 and is currently estimated at $536,781, approximately $296 per square foot. 9202 Quail Cove is a home located in Travis County with nearby schools including Wooldridge Elementary School, Burnet Middle School, and Navarro Early College High School.
Ownership History
Date
Name
Owned For
Owner Type
Purchase Details
Closed on
Sep 18, 2018
Sold by
Douglas Keith
Bought by
Goode Garrett and Goode Gloria
Current Estimated Value
Home Financials for this Owner
Home Financials are based on the most recent Mortgage that was taken out on this home.
Original Mortgage
$367,145
Outstanding Balance
$319,513
Interest Rate
4.5%
Mortgage Type
Purchase Money Mortgage
Estimated Equity
$217,268
Purchase Details
Closed on
Mar 29, 2018
Sold by
Alamo City Fianncial Llc
Bought by
Douglas Keith
Purchase Details
Closed on
May 7, 2010
Sold by
Acosta Lauren F
Bought by
Acosta Robert T
Purchase Details
Closed on
Jul 15, 2004
Sold by
Rogers Robert R and Rogers Debra R
Bought by
Acosta Edward and Acosta Lauren Fenton
Home Financials for this Owner
Home Financials are based on the most recent Mortgage that was taken out on this home.
Original Mortgage
$102,400
Interest Rate
6.26%
Mortgage Type
Purchase Money Mortgage
Create a Home Valuation Report for This Property
The Home Valuation Report is an in-depth analysis detailing your home's value as well as a comparison with similar homes in the area
Home Values in the Area
Average Home Value in this Area
Purchase History
| Date | Buyer | Sale Price | Title Company |
|---|---|---|---|
| Goode Garrett | -- | Texas National Title | |
| Douglas Keith | -- | None Available | |
| Alamo City Financial Llc | -- | Independence Title Co | |
| Acosta Robert T | -- | None Available | |
| Acosta Edward | -- | Atc |
Source: Public Records
Mortgage History
| Date | Status | Borrower | Loan Amount |
|---|---|---|---|
| Open | Goode Garrett | $367,145 | |
| Previous Owner | Acosta Edward | $102,400 |
Source: Public Records
Tax History Compared to Growth
Tax History
| Year | Tax Paid | Tax Assessment Tax Assessment Total Assessment is a certain percentage of the fair market value that is determined by local assessors to be the total taxable value of land and additions on the property. | Land | Improvement |
|---|---|---|---|---|
| 2025 | $7,914 | $477,813 | $212,794 | $265,019 |
| 2023 | $7,091 | $485,361 | $0 | $0 |
| 2022 | $8,714 | $441,237 | $0 | $0 |
| 2021 | $8,731 | $401,125 | $125,000 | $304,862 |
| 2020 | $7,821 | $364,659 | $125,000 | $239,659 |
| 2019 | $8,010 | $364,659 | $125,000 | $239,659 |
| 2018 | $6,811 | $307,633 | $125,000 | $182,633 |
| 2017 | $5,153 | $231,047 | $75,000 | $156,047 |
| 2016 | $4,552 | $176,010 | $60,000 | $116,010 |
| 2015 | $3,507 | $167,583 | $20,000 | $147,583 |
| 2014 | $3,507 | $147,359 | $20,000 | $127,359 |
Source: Public Records
Map
Nearby Homes
- 9303 Quail Field Dr
- 1010 W Rundberg Ln Unit 13
- 1010 W Rundberg Ln Unit 24
- 9100 Shepard Dr
- 9010 Laurel Grove Dr
- 9104 Glenn Ln
- 8909 Laurel Grove Dr
- 9504 Quail Village Ln
- 9007 Quail Valley Dr
- 903 Silver Quail Ln
- 9209 Slayton Dr
- 1207 W Rundberg Ln
- 106 W Fawnridge Dr Unit 1
- 106 W Fawnridge Dr Unit 2
- 901 E Village Ln
- 9104 Georgian Dr
- 11108 Georgian Dr
- 8906 Parkfield Dr Unit C
- 8906 Trone Cir Unit A
- 8520 Bradford Dr
- 9204 Quail Cove
- 9200 Quail Cove
- 9203 Quail Field Dr
- 9205 Quail Field Dr
- 9206 Quail Cove
- 9207 Quail Field Dr
- 9205 Quail Cove
- 9203 Quail Cove
- 9207 Quail Cove
- 9212 Quail Cove
- 9201 Quail Cove
- 9209 Quail Field Dr
- 9200 Quail Field Dr
- 9202 Quail Field Dr
- 1001 Quail Park Dr
- 1003 Quail Park Dr
- 9200 Indian Quail Cir
- 9209 Quail Cove
- 1007 Quail Park Dr
- 9206 Quail Field Dr