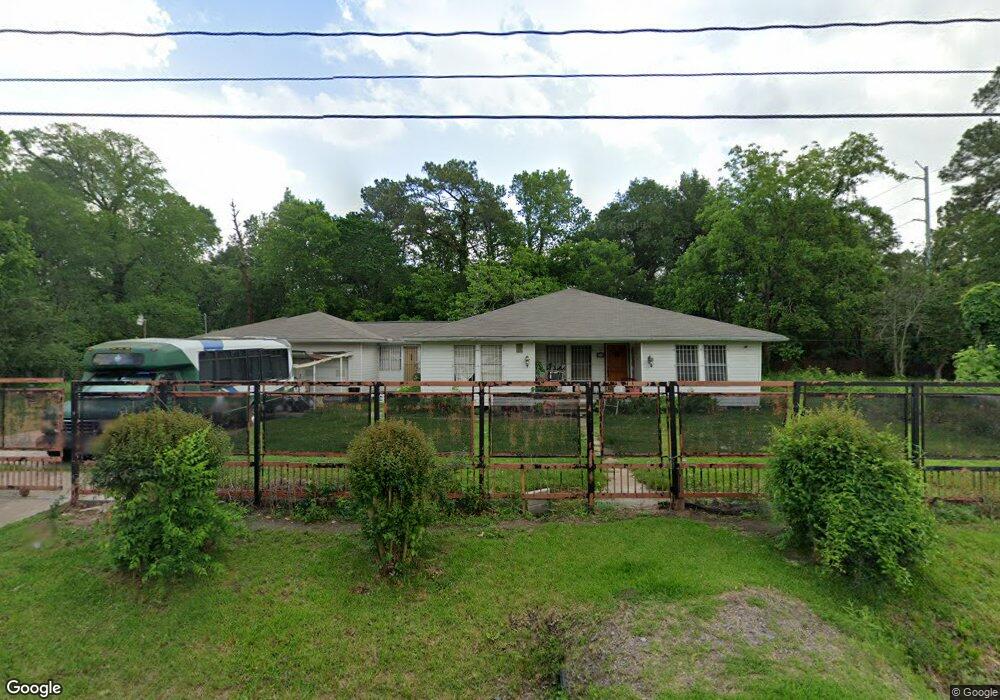
9202 Sherbourne St Houston, TX 77016
Trinity-Houston Gardens NeighborhoodEstimated Value: $190,000 - $339,000
4
Beds
1
Bath
2,094
Sq Ft
$138/Sq Ft
Est. Value
About This Home
This home is located at 9202 Sherbourne St, Houston, TX 77016 and is currently estimated at $288,582, approximately $137 per square foot. 9202 Sherbourne St is a home located in Harris County with nearby schools including Shadydale Elementary School, Forest Brook Middle, and North Forest High School.
Ownership History
Date
Name
Owned For
Owner Type
Purchase Details
Closed on
Mar 12, 2010
Sold by
Metz John
Bought by
Jurado Anabel T
Current Estimated Value
Home Financials for this Owner
Home Financials are based on the most recent Mortgage that was taken out on this home.
Original Mortgage
$55,000
Outstanding Balance
$17,487
Interest Rate
4.97%
Mortgage Type
Purchase Money Mortgage
Estimated Equity
$271,095
Purchase Details
Closed on
Aug 13, 2008
Sold by
Liquidation Properties Inc
Bought by
Metz John
Purchase Details
Closed on
Aug 5, 2008
Sold by
Gmac Mortgage Llc
Bought by
Liquidation Properties Inc
Purchase Details
Closed on
Jun 13, 2008
Sold by
Hawkins Gary and Mortgage Electronic Registrati
Bought by
Gmac Mortgage Llc
Purchase Details
Closed on
Nov 14, 2005
Sold by
Johnson William Douglas
Bought by
Hawkins Gary
Home Financials for this Owner
Home Financials are based on the most recent Mortgage that was taken out on this home.
Original Mortgage
$81,600
Interest Rate
7.6%
Mortgage Type
Fannie Mae Freddie Mac
Create a Home Valuation Report for This Property
The Home Valuation Report is an in-depth analysis detailing your home's value as well as a comparison with similar homes in the area
Home Values in the Area
Average Home Value in this Area
Purchase History
| Date | Buyer | Sale Price | Title Company |
|---|---|---|---|
| Jurado Anabel T | -- | None Available | |
| Metz John | -- | First American Title | |
| Liquidation Properties Inc | -- | First American Title | |
| Gmac Mortgage Llc | $17,500 | None Available | |
| Hawkins Gary | -- | Netco |
Source: Public Records
Mortgage History
| Date | Status | Borrower | Loan Amount |
|---|---|---|---|
| Open | Jurado Anabel T | $55,000 | |
| Previous Owner | Hawkins Gary | $81,600 |
Source: Public Records
Tax History Compared to Growth
Tax History
| Year | Tax Paid | Tax Assessment Tax Assessment Total Assessment is a certain percentage of the fair market value that is determined by local assessors to be the total taxable value of land and additions on the property. | Land | Improvement |
|---|---|---|---|---|
| 2025 | $595 | $341,424 | $201,600 | $139,824 |
| 2024 | $595 | $341,678 | $201,600 | $140,078 |
| 2023 | $595 | $303,909 | $151,200 | $152,709 |
| 2022 | $623 | $218,082 | $100,800 | $117,282 |
| 2021 | $1,245 | $167,077 | $67,200 | $99,877 |
| 2020 | $1,176 | $152,093 | $67,200 | $84,893 |
| 2019 | $1,117 | $132,471 | $53,760 | $78,711 |
| 2018 | $514 | $110,095 | $53,760 | $56,335 |
| 2017 | $922 | $110,095 | $53,760 | $56,335 |
| 2016 | $839 | $87,287 | $42,000 | $45,287 |
| 2015 | $775 | $30,150 | $12,558 | $17,592 |
| 2014 | $775 | $30,150 | $12,558 | $17,592 |
Source: Public Records
Map
Nearby Homes
- 9313 Sherbourne St
- 9318 Sherbourne St
- 7423 Sundown3 Dr
- 9316 Sundown Dr
- 7501 Crofton St
- 7423 Sundown Dr
- 7441 Fawnridge Dr
- 9412 Firnat St Unit A-B
- 9412 Crofton St
- 9437 Pembrook St
- 7410 Glen Manor Dr
- 7319 Laura Koppe Rd
- 8928 Homestead Rd
- 7321 Laura Koppe Rd
- 7527 Crofton St
- 0 Crofton St
- 6213 Laura Koppe Rd
- 7445 Laura Koppe
- 9227 Homestead Rd
- 7229 Springdale St
- 0 Sherbourne St
- 8914 & 8918 Sherbourne St
- 9206 Sherbourne St
- 9203 Sherbourne St
- 9208 Sherbourne St
- 9205 Sherbourne St
- 8860 Sundown St
- 9215 Sherbourne St
- 9114 Sherbourne St
- 9110 Sherbourne St
- 9119 Sherbourne St
- 9119 Sherbourne St Unit A
- 9119 Sherbourne St Unit B
- 9119 Sherbourne St Unit A
- 9119 Sherbourne St
- 9206 Pembrook St
- 9202 Pembrook St
- 9214 Pembrook St
- 9306 Sherbourne St
- 9115 Sherbourne St