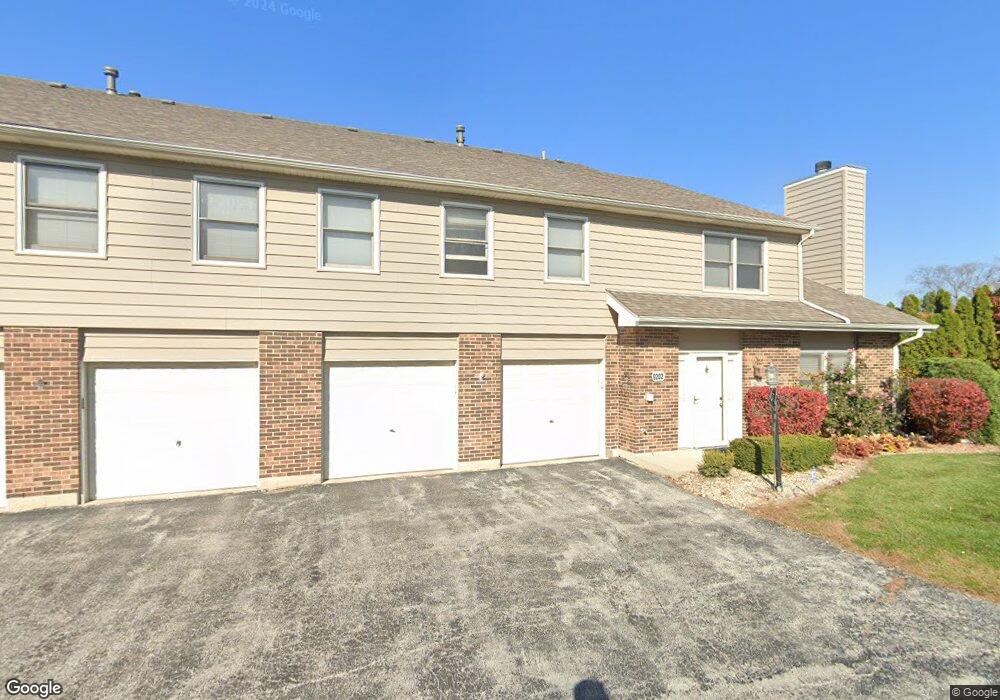
9202 Wherry Ln Unit 76D Orland Park, IL 60462
Central Orland NeighborhoodEstimated Value: $266,000 - $295,000
2
Beds
2
Baths
1,574
Sq Ft
$180/Sq Ft
Est. Value
About This Home
This home is located at 9202 Wherry Ln Unit 76D, Orland Park, IL 60462 and is currently estimated at $282,594, approximately $179 per square foot. 9202 Wherry Ln Unit 76D is a home located in Cook County with nearby schools including Orland Center School, Liberty Elementary School, and Jerling Junior High School.
Ownership History
Date
Name
Owned For
Owner Type
Purchase Details
Closed on
Apr 23, 2018
Sold by
Gricus Michael C
Bought by
Ton Vankha and Ton Be Nu Thi
Current Estimated Value
Purchase Details
Closed on
Oct 24, 2001
Sold by
Gricus Jodi Ann
Bought by
Gricus Michael C
Home Financials for this Owner
Home Financials are based on the most recent Mortgage that was taken out on this home.
Original Mortgage
$144,000
Interest Rate
7.07%
Purchase Details
Closed on
May 26, 2000
Sold by
Mckevoy Teresa
Bought by
Gricus Michael and Marino Jodi A
Home Financials for this Owner
Home Financials are based on the most recent Mortgage that was taken out on this home.
Original Mortgage
$142,800
Interest Rate
8.18%
Mortgage Type
FHA
Purchase Details
Closed on
Oct 16, 1998
Sold by
Greene Richard G and Beck Bonnie L
Bought by
Mcevoy Teresa
Home Financials for this Owner
Home Financials are based on the most recent Mortgage that was taken out on this home.
Original Mortgage
$131,550
Interest Rate
6.88%
Create a Home Valuation Report for This Property
The Home Valuation Report is an in-depth analysis detailing your home's value as well as a comparison with similar homes in the area
Home Values in the Area
Average Home Value in this Area
Purchase History
| Date | Buyer | Sale Price | Title Company |
|---|---|---|---|
| Ton Vankha | $175,000 | Fidelity National Title | |
| Gricus Michael C | -- | -- | |
| Gricus Michael | $147,000 | -- | |
| Mcevoy Teresa | -- | -- |
Source: Public Records
Mortgage History
| Date | Status | Borrower | Loan Amount |
|---|---|---|---|
| Previous Owner | Gricus Michael C | $144,000 | |
| Previous Owner | Gricus Michael | $142,800 | |
| Previous Owner | Mcevoy Teresa | $131,550 |
Source: Public Records
Tax History Compared to Growth
Tax History
| Year | Tax Paid | Tax Assessment Tax Assessment Total Assessment is a certain percentage of the fair market value that is determined by local assessors to be the total taxable value of land and additions on the property. | Land | Improvement |
|---|---|---|---|---|
| 2024 | $6,351 | $25,380 | $2,405 | $22,975 |
| 2023 | $5,426 | $25,380 | $2,405 | $22,975 |
| 2022 | $5,426 | $18,114 | $2,116 | $15,998 |
| 2021 | $5,241 | $18,114 | $2,116 | $15,998 |
| 2020 | $5,044 | $18,114 | $2,116 | $15,998 |
| 2019 | $4,441 | $16,180 | $1,923 | $14,257 |
| 2018 | $3,402 | $16,180 | $1,923 | $14,257 |
| 2017 | $3,341 | $16,180 | $1,923 | $14,257 |
| 2016 | $3,783 | $16,055 | $1,731 | $14,324 |
| 2015 | $3,712 | $16,055 | $1,731 | $14,324 |
| 2014 | $3,672 | $16,055 | $1,731 | $14,324 |
| 2013 | $4,032 | $18,361 | $1,731 | $16,630 |
Source: Public Records
Map
Nearby Homes
- 15511 Westminster Dr Unit 65B
- 9209 Cliffside Ln Unit 54C
- 9314 Wherry Ln Unit D
- 9203 Wheeler Dr
- 9291 Erin Ln Unit D7
- 9350 Waterford Ln Unit C16
- 9337 Waterford Ln Unit D3
- 15336 Regent Dr
- 15324 Regent Dr
- 15963 91st Ave
- 56 Orland Square Dr
- 15726 Orlan Brook Dr Unit 193
- 9180 136th St
- 15633 Orlan Brook Dr
- 16040 Boardwalk Ln Unit 4A
- 15301 Wilshire Dr
- 9061 Somerset Ct Unit 16
- 8624 Kendall Ln
- 15826 Orlan Brook Dr Unit 3S
- 15713 Orlan Brook Dr Unit 98
- 9214 Wherry Ln Unit 76A
- 9210 Wherry Ln Unit 76B
- 9218 Wherry Ln Unit 75B
- 9230 Wherry Ln Unit 75D
- 9222 Wherry Ln Unit 75A
- 15530 Peachtree Dr
- 9226 Wherry Ln Unit 75C
- 15515 Wherry Ln Unit 77B
- 15511 Wherry Ln Unit 77C
- 15520 Peachtree Dr Unit 6
- 15513 Wherry Ln Unit 77D
- 15540 Peachtree Dr
- 15517 Wherry Ln Unit 77A
- 9215 Wherry Ln Unit 63A
- 15523 Wherry Ln Unit 57D
- 9203 Wherry Ln Unit 63C
- 9211 Wherry Ln Unit 63B
- 9207 Wherry Ln Unit 63D
- 15510 Peachtree Dr
- 9221 Wheeler Dr