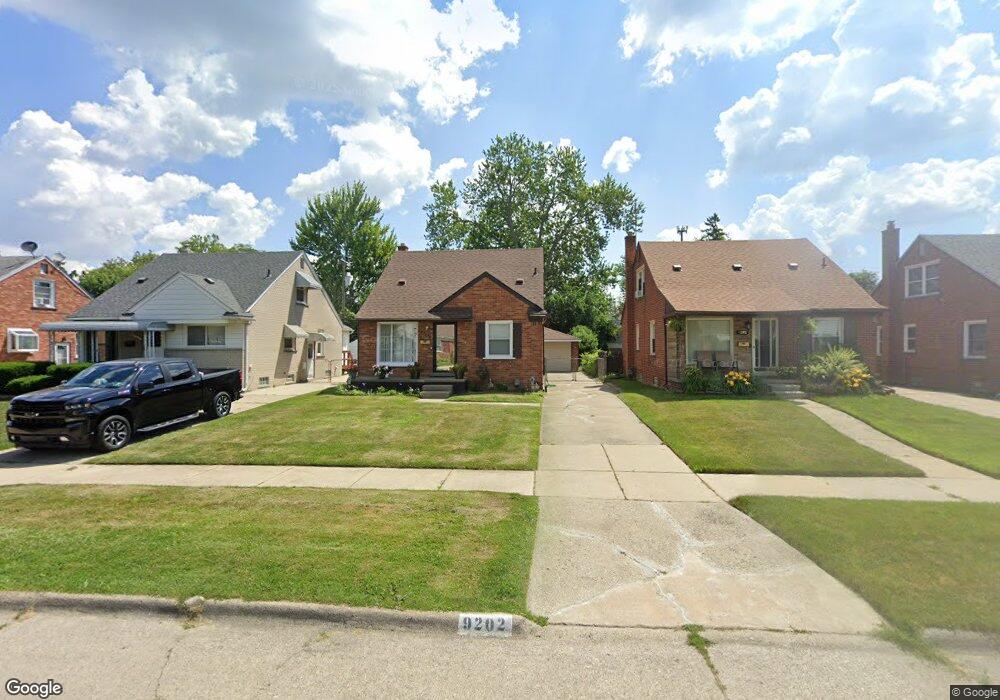
9202 Winston Redford, MI 48239
Estimated Value: $189,868 - $220,000
Studio
1
Bath
1,275
Sq Ft
$162/Sq Ft
Est. Value
About This Home
This home is located at 9202 Winston, Redford, MI 48239 and is currently estimated at $206,967, approximately $162 per square foot. 9202 Winston is a home located in Wayne County with nearby schools including John D. Pierce Middle School, Lee M. Thurston High School, and Global Heights Academy.
Ownership History
Date
Name
Owned For
Owner Type
Purchase Details
Closed on
May 18, 2017
Sold by
Fraser Scott
Bought by
C I Investments
Current Estimated Value
Purchase Details
Closed on
Oct 18, 2006
Sold by
Frison Geraldetta
Bought by
Citibank Na and Bear Stearns Asset Backed Securities I T
Purchase Details
Closed on
Mar 9, 2004
Sold by
Knight Jeff and Knight Holly
Bought by
Frison Geraldetta
Home Financials for this Owner
Home Financials are based on the most recent Mortgage that was taken out on this home.
Original Mortgage
$95,200
Interest Rate
8.12%
Mortgage Type
Purchase Money Mortgage
Purchase Details
Closed on
Feb 6, 2004
Sold by
Knight Jeff
Bought by
Knight Holly
Home Financials for this Owner
Home Financials are based on the most recent Mortgage that was taken out on this home.
Original Mortgage
$95,200
Interest Rate
8.12%
Mortgage Type
Purchase Money Mortgage
Purchase Details
Closed on
Jan 7, 2004
Sold by
Knight Jeff and Knight Holly
Bought by
Midwest Land Partnership
Create a Home Valuation Report for This Property
The Home Valuation Report is an in-depth analysis detailing your home's value as well as a comparison with similar homes in the area
Home Values in the Area
Average Home Value in this Area
Purchase History
| Date | Buyer | Sale Price | Title Company |
|---|---|---|---|
| C I Investments | $60,000 | Title One Inc | |
| Citibank Na | $115,523 | None Available | |
| Frison Geraldetta | $119,000 | Liberty Title Insurance Agen | |
| Knight Holly | -- | -- | |
| Midwest Land Partnership | $69,536 | -- |
Source: Public Records
Mortgage History
| Date | Status | Borrower | Loan Amount |
|---|---|---|---|
| Previous Owner | Frison Geraldetta | $95,200 |
Source: Public Records
Tax History
| Year | Tax Paid | Tax Assessment Tax Assessment Total Assessment is a certain percentage of the fair market value that is determined by local assessors to be the total taxable value of land and additions on the property. | Land | Improvement |
|---|---|---|---|---|
| 2025 | $1,407 | $82,300 | $0 | $0 |
| 2024 | $1,368 | $76,700 | $0 | $0 |
| 2023 | $1,308 | $66,300 | $0 | $0 |
| 2022 | $3,403 | $56,700 | $0 | $0 |
| 2021 | $3,304 | $53,300 | $0 | $0 |
| 2020 | $3,258 | $48,800 | $0 | $0 |
| 2019 | $3,190 | $42,200 | $0 | $0 |
| 2018 | $1,167 | $36,300 | $0 | $0 |
| 2017 | $2,725 | $33,700 | $0 | $0 |
| 2016 | $1,736 | $34,900 | $0 | $0 |
| 2015 | $2,704 | $32,200 | $0 | $0 |
| 2013 | $2,620 | $26,700 | $0 | $0 |
| 2012 | $2,155 | $29,700 | $6,600 | $23,100 |
Source: Public Records
Map
Nearby Homes
Your Personal Tour Guide
Ask me questions while you tour the home.