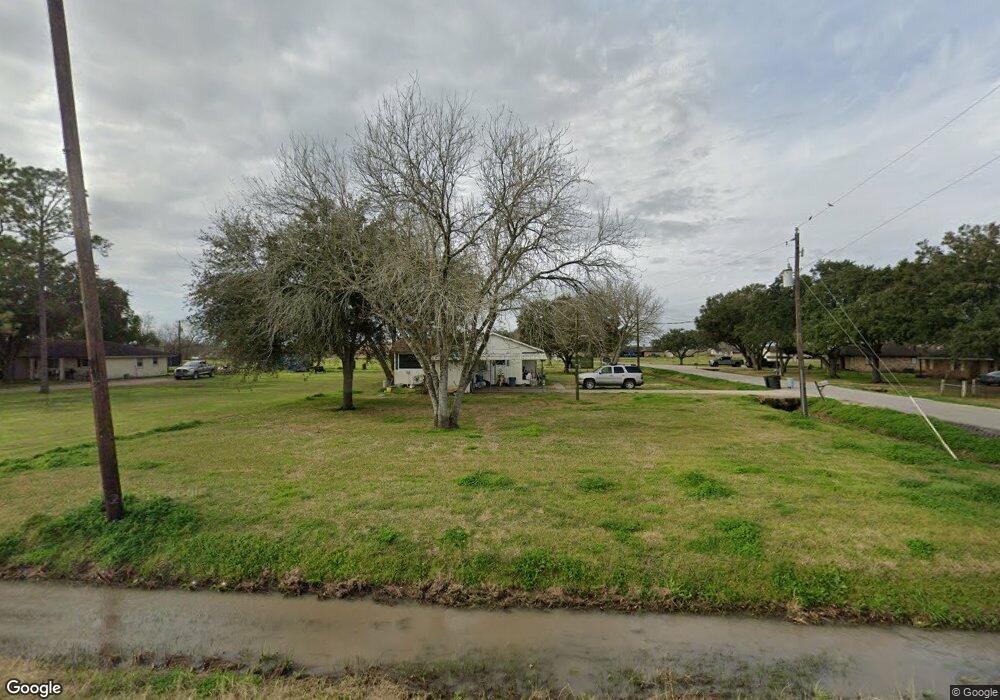
9204 Jeske Rd Needville, TX 77461
Estimated Value: $200,000 - $304,000
2
Beds
1
Bath
1,121
Sq Ft
$222/Sq Ft
Est. Value
About This Home
This home is located at 9204 Jeske Rd, Needville, TX 77461 and is currently estimated at $248,423, approximately $221 per square foot. 9204 Jeske Rd is a home located in Fort Bend County with nearby schools including Needville Elementary School, Needville Junior High School, and Needville Middle School.
Ownership History
Date
Name
Owned For
Owner Type
Purchase Details
Closed on
Aug 10, 2021
Sold by
Kucera Kellie M
Bought by
Kucera Daryl J
Current Estimated Value
Purchase Details
Closed on
Feb 25, 2010
Sold by
Raesner Larry and Raesner Deanna
Bought by
Kucera Daryl J and Kucera Kellie M
Home Financials for this Owner
Home Financials are based on the most recent Mortgage that was taken out on this home.
Original Mortgage
$73,641
Interest Rate
5.25%
Mortgage Type
FHA
Purchase Details
Closed on
Jun 27, 2000
Sold by
Winkelman Sherry L
Bought by
Raesner Larry
Home Financials for this Owner
Home Financials are based on the most recent Mortgage that was taken out on this home.
Original Mortgage
$51,100
Interest Rate
8.66%
Purchase Details
Closed on
Sep 13, 1994
Sold by
Boyd Clara
Bought by
Kucera Daryl J and Kucera Kellie M
Create a Home Valuation Report for This Property
The Home Valuation Report is an in-depth analysis detailing your home's value as well as a comparison with similar homes in the area
Home Values in the Area
Average Home Value in this Area
Purchase History
| Date | Buyer | Sale Price | Title Company |
|---|---|---|---|
| Kucera Daryl J | -- | None Available | |
| Kucera Daryl J | -- | Stewart Title Richmond | |
| Raesner Larry | -- | Startex Title Company | |
| Kucera Daryl J | -- | -- |
Source: Public Records
Mortgage History
| Date | Status | Borrower | Loan Amount |
|---|---|---|---|
| Previous Owner | Kucera Daryl J | $73,641 | |
| Previous Owner | Raesner Larry | $51,100 |
Source: Public Records
Tax History Compared to Growth
Tax History
| Year | Tax Paid | Tax Assessment Tax Assessment Total Assessment is a certain percentage of the fair market value that is determined by local assessors to be the total taxable value of land and additions on the property. | Land | Improvement |
|---|---|---|---|---|
| 2025 | $1,880 | $188,097 | $90,000 | $99,196 |
| 2024 | $1,880 | $170,997 | $86,000 | $84,997 |
| 2023 | $3,177 | $162,963 | $76,500 | $86,463 |
| 2022 | $3,147 | $159,420 | $66,890 | $92,530 |
| 2021 | $2,072 | $109,320 | $35,000 | $74,320 |
| 2020 | $2,167 | $107,200 | $35,000 | $72,200 |
| 2019 | $2,092 | $97,450 | $35,000 | $62,450 |
| 2018 | $2,035 | $94,910 | $35,000 | $59,910 |
| 2017 | $1,856 | $86,280 | $26,000 | $60,280 |
| 2016 | $1,687 | $78,440 | $22,500 | $55,940 |
| 2015 | $1,099 | $71,310 | $12,700 | $58,610 |
| 2014 | $1,136 | $64,830 | $12,700 | $52,130 |
Source: Public Records
Map
Nearby Homes
- 9103 Jeske Rd
- 9519 Sweet Tea Ln
- 14202 Golden Wheat Ln
- 14207 Golden Wheat Ln
- 14223 Hay Meadow Ln
- 14203 Golden Wheat Ln
- Model #2781 Plan at Blue Jay's Landing
- Model #2555 Plan at Blue Jay's Landing
- Model #2295 Plan at Blue Jay's Landing
- Model #2497 Plan at Blue Jay's Landing
- Model #2306 Plan at Blue Jay's Landing
- Model #2381 Plan at Blue Jay's Landing
- Model #3086 Plan at Blue Jay's Landing
- 9910 Jeske Rd
- 11018 Moon Light Dr
- 11034 Moon Light Dr
- 11127 Moon Light Dr
- 9430 Oberrender Rd
- 10202 Harry Dr
- 10335 Filly Dr