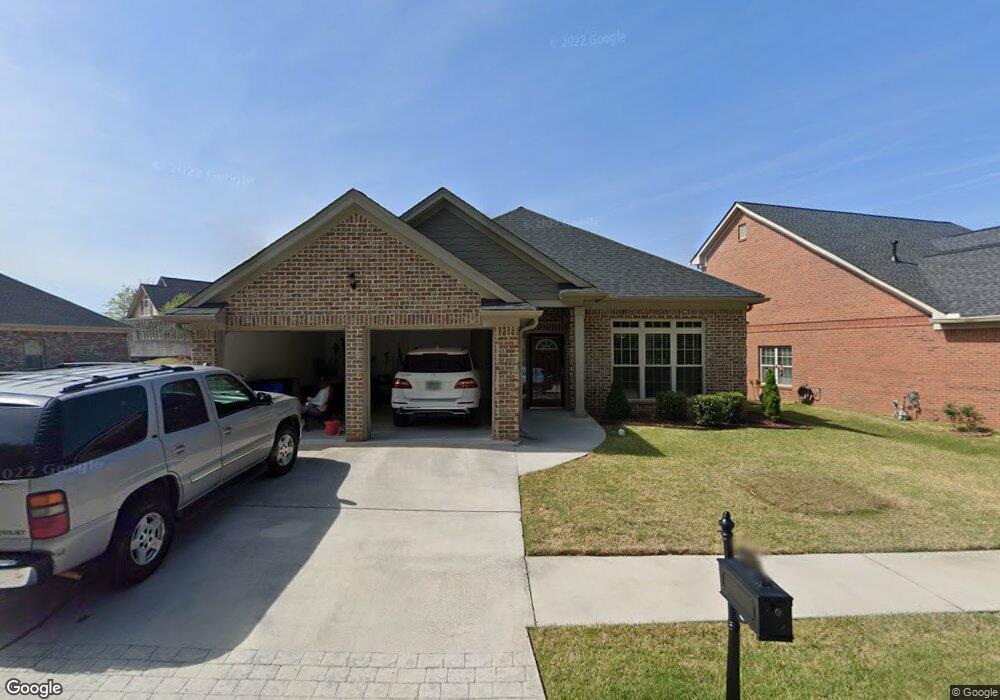
9204 Malcom Dr Covington, GA 30014
Estimated Value: $297,780 - $325,000
3
Beds
3
Baths
1,535
Sq Ft
$205/Sq Ft
Est. Value
About This Home
This home is located at 9204 Malcom Dr, Covington, GA 30014 and is currently estimated at $314,695, approximately $205 per square foot. 9204 Malcom Dr is a home located in Newton County with nearby schools including Middle Ridge Elementary School, Cousins Middle School, and Eastside High School.
Ownership History
Date
Name
Owned For
Owner Type
Purchase Details
Closed on
Apr 30, 2025
Sold by
Hobbs Darwin
Bought by
Jolley Rhonda J
Current Estimated Value
Purchase Details
Closed on
Mar 9, 2018
Sold by
Catalina Hernandez Rubio
Bought by
Houston Brian
Home Financials for this Owner
Home Financials are based on the most recent Mortgage that was taken out on this home.
Original Mortgage
$140,000
Interest Rate
4.46%
Purchase Details
Closed on
Mar 7, 2018
Sold by
Vibrance Inc
Bought by
Hobbs Darwin and Hobbs Sherrie
Home Financials for this Owner
Home Financials are based on the most recent Mortgage that was taken out on this home.
Original Mortgage
$140,000
Interest Rate
4.46%
Purchase Details
Closed on
Sep 15, 2015
Sold by
The Right Location Llc
Bought by
Vibrance Inc
Purchase Details
Closed on
Jun 25, 2015
Sold by
Jdd Quality Builders Inc
Bought by
The Right Location Llc
Create a Home Valuation Report for This Property
The Home Valuation Report is an in-depth analysis detailing your home's value as well as a comparison with similar homes in the area
Home Values in the Area
Average Home Value in this Area
Purchase History
| Date | Buyer | Sale Price | Title Company |
|---|---|---|---|
| Jolley Rhonda J | $313,500 | -- | |
| Houston Brian | -- | -- | |
| Hobbs Darwin | $185,000 | -- | |
| Vibrance Inc | $25,000 | -- | |
| The Right Location Llc | $30,000 | -- |
Source: Public Records
Mortgage History
| Date | Status | Borrower | Loan Amount |
|---|---|---|---|
| Previous Owner | Houston Brian | $140,000 | |
| Previous Owner | Houston Brian | -- | |
| Previous Owner | Hobbs Darwin | $191,105 |
Source: Public Records
Map
Nearby Homes
- 8193 Monticello St
- 10110 Malcolm Ct
- 10155 Malcolm Dr
- 10184 Malcolm Dr
- 85 Bellerive Ln SE
- 8 Jackson Rd
- 130 S Links Dr
- 0 Petty St Unit 10547316
- 0 Petty St Unit 7640177
- 7155 Petty St SW
- 7703 Fawn Cir
- 7713 Fawn Cir Unit 51
- 8239 High Lake Terrace SE
- 8151 Puckett St SW
- 7120 Chaney Dr SW
- 9187 Plantation Cir
- 7762 Fawn Cir
- 6195 Petty St SW
- 8112 Puckett St SW
- 6175 Petty St SW
- 9204 Malcolm Dr Unit 43
- 9210 Malcolm Dr
- 9198 Malcom Dr
- 9192 Leverett Cir
- 9198 Malcolm Dr
- 9216 Malcolm Dr
- 9209 Malcolm Dr
- 9192 Malcolm Dr
- 9119 Leverett Cir
- 10102 Malcolm Dr
- 10102 Malcolm Dr Unit 1
- 9117 Leverett Cir
- 9186 Malcom Ln
- 9186 Malcom Dr
- 9186 Malcolm Dr
- 10113 Leverett Cir
- 9103 Whispering Pines Cir
- 10108 Malcolm Dr Unit /47
- 10108 Malcolm Dr
- 9180 Malcolm Dr
Your Personal Tour Guide
Ask me questions while you tour the home.