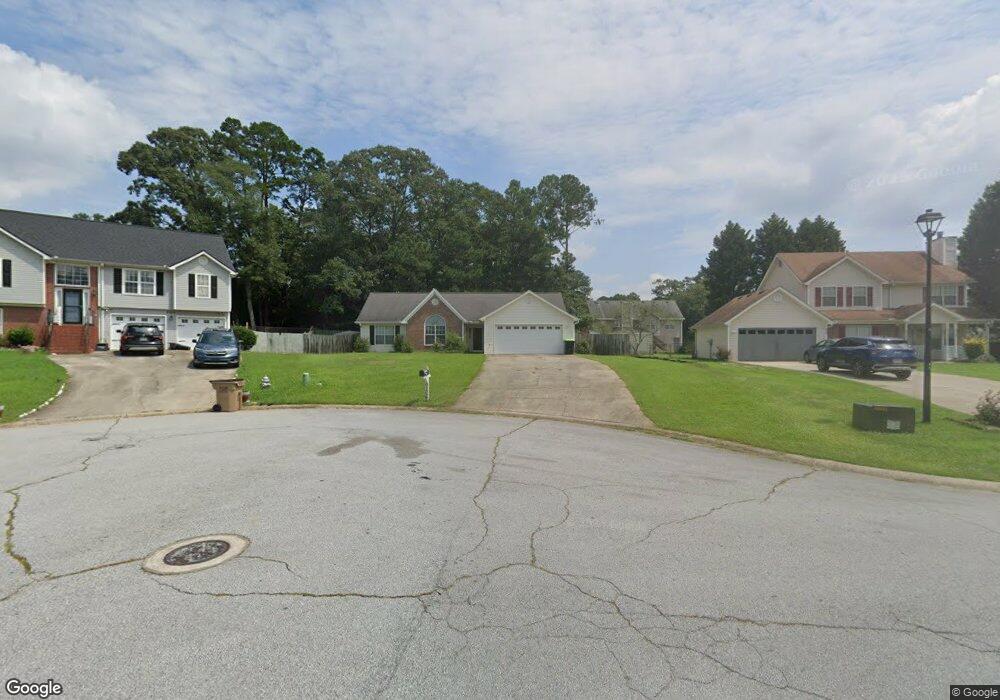
9206 Jenni Cir Jonesboro, GA 30238
Estimated Value: $242,000 - $278,000
3
Beds
2
Baths
1,562
Sq Ft
$166/Sq Ft
Est. Value
About This Home
This home is located at 9206 Jenni Cir, Jonesboro, GA 30238 and is currently estimated at $259,750, approximately $166 per square foot. 9206 Jenni Cir is a home located in Clayton County with nearby schools including Brown Elementary School, Mundys Mill Middle School, and Mundy's Mill High School.
Ownership History
Date
Name
Owned For
Owner Type
Purchase Details
Closed on
Dec 31, 2018
Sold by
Vincent Paul
Bought by
Vincent Pmdb Properties Inc
Current Estimated Value
Purchase Details
Closed on
Jun 14, 2016
Sold by
Taylor Christine H
Bought by
Vincent Paul and Vincent Marie
Purchase Details
Closed on
Aug 1, 2007
Sold by
Ng Henry K and Ng Marbel M
Bought by
Taylor Christine H
Home Financials for this Owner
Home Financials are based on the most recent Mortgage that was taken out on this home.
Original Mortgage
$120,000
Interest Rate
6.63%
Mortgage Type
New Conventional
Purchase Details
Closed on
Feb 14, 2000
Sold by
L & L Builders Inc
Bought by
Ng Henry K and Ng Mabel M
Home Financials for this Owner
Home Financials are based on the most recent Mortgage that was taken out on this home.
Original Mortgage
$72,900
Interest Rate
8.17%
Mortgage Type
New Conventional
Create a Home Valuation Report for This Property
The Home Valuation Report is an in-depth analysis detailing your home's value as well as a comparison with similar homes in the area
Home Values in the Area
Average Home Value in this Area
Purchase History
| Date | Buyer | Sale Price | Title Company |
|---|---|---|---|
| Vincent Pmdb Properties Inc | -- | -- | |
| Vincent Paul | $113,000 | -- | |
| Taylor Christine H | $120,000 | -- | |
| Ng Henry K | $112,900 | -- |
Source: Public Records
Mortgage History
| Date | Status | Borrower | Loan Amount |
|---|---|---|---|
| Previous Owner | Taylor Christine H | $120,000 | |
| Previous Owner | Ng Henry K | $72,900 |
Source: Public Records
Tax History Compared to Growth
Tax History
| Year | Tax Paid | Tax Assessment Tax Assessment Total Assessment is a certain percentage of the fair market value that is determined by local assessors to be the total taxable value of land and additions on the property. | Land | Improvement |
|---|---|---|---|---|
| 2024 | $3,201 | $81,080 | $8,000 | $73,080 |
| 2023 | $2,779 | $76,960 | $8,000 | $68,960 |
| 2022 | $2,237 | $56,040 | $8,000 | $48,040 |
| 2021 | $2,006 | $49,840 | $8,000 | $41,840 |
| 2020 | $1,921 | $47,069 | $8,000 | $39,069 |
| 2019 | $1,986 | $47,974 | $6,400 | $41,574 |
| 2018 | $1,718 | $41,387 | $6,400 | $34,987 |
| 2017 | $1,655 | $39,737 | $6,400 | $33,337 |
| 2016 | $1,188 | $28,264 | $6,400 | $21,864 |
| 2015 | $1,169 | $0 | $0 | $0 |
| 2014 | $1,110 | $26,960 | $6,400 | $20,560 |
Source: Public Records
Map
Nearby Homes
- 755 Dunaire Way
- 8843 Fayetteville Rd
- 8857 Woodridge Ct
- 692 Sedgwick Dr
- 631 Crestmont Ct
- 532 Flint Ridge Ct Unit 1
- 9381 Windward Ct
- 0 State Highway 54
- 439 Windy Ct
- 443 Windy Ct
- 447 Windy Ct
- 770 Four Winds Ln
- 445 Westside Dr
- 192 Cloud St
- 153 Burnside St
- 687 Utoy Ct
- 116 Stewart Ave
- 761 Robert e Lee Pkwy
- 556 Maggie Ln
- 9260 Ryan Ridge Ct
- 9210 Jenni Cir Unit 1
- 9202 Jenni Cir Unit 1
- 9094 Jenni Cir
- 9198 Jenni Cir
- 9198 Jenni Cir Unit 1
- 9098 Jenni Cir Unit 2
- 9046 Jenni Cir
- 9046 Jenni Cir Unit 2
- 9042 Jenni Cir
- 9038 Jenni Cir Unit 1
- 9084 Jenni Cir
- 737 Jenni Ln
- 0 Jenni Cir Unit 3233564
- 0 Jenni Cir Unit 3213241
- 0 Jenni Cir Unit 8428185
- 0 Jenni Cir Unit 8727933
- 0 Jenni Cir Unit 8775108
- 0 Jenni Cir Unit 8894634
- 0 Jenni Cir Unit 3149838
- 0 Jenni Cir Unit 3165084