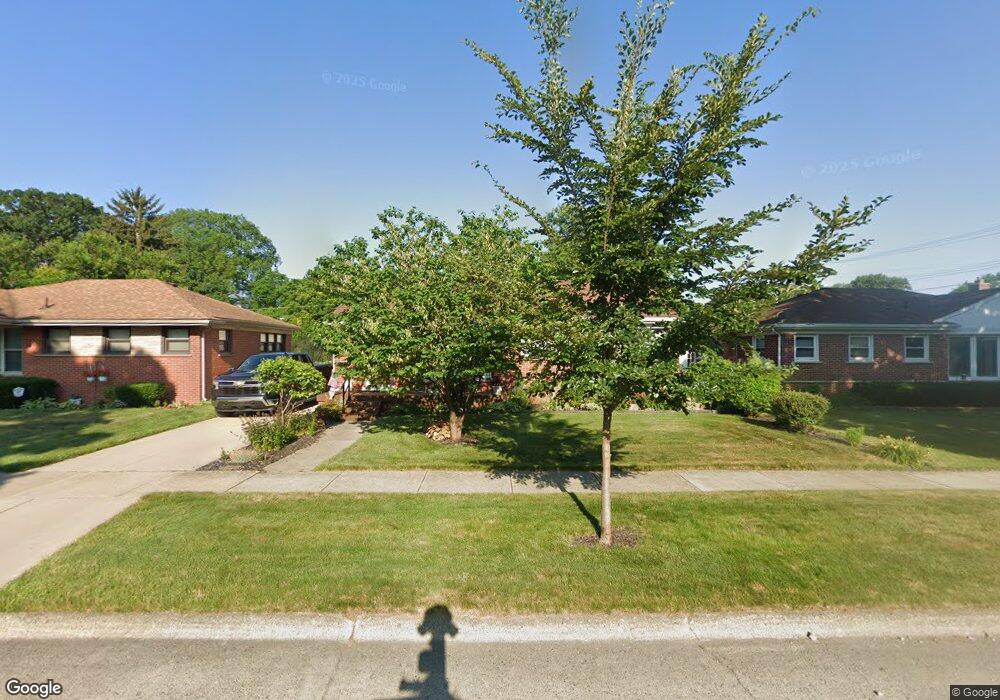
9207 Columbia Redford, MI 48239
Estimated Value: $184,000 - $238,000
3
Beds
2
Baths
1,092
Sq Ft
$194/Sq Ft
Est. Value
About This Home
This home is located at 9207 Columbia, Redford, MI 48239 and is currently estimated at $211,800, approximately $193 per square foot. 9207 Columbia is a home located in Wayne County with nearby schools including John D. Pierce Middle School, Lee M. Thurston High School, and Westfield Charter Academy.
Ownership History
Date
Name
Owned For
Owner Type
Purchase Details
Closed on
Aug 27, 2013
Sold by
Einem Mark E and Einem Jane
Bought by
Peter William R
Current Estimated Value
Purchase Details
Closed on
Mar 15, 2010
Sold by
Mortgage Electronic Registration Systems
Bought by
The Bank Of New York Mellon and The Bank Of New York
Purchase Details
Closed on
Mar 10, 2010
Sold by
Schleicher Ryan
Bought by
Mortgage Electronic Registration Systems
Purchase Details
Closed on
Oct 30, 2003
Sold by
Mcallister John E and Mcallister Kimberly S
Bought by
Schleicher Ryan
Purchase Details
Closed on
Jul 31, 2003
Sold by
Mcallister John E and Mcallister Kimberly S
Bought by
Citifinancial Mortgage Co Inc and Associates Home Equity Services Inc
Purchase Details
Closed on
Nov 22, 2000
Sold by
Herbst Robert D
Bought by
Mcallister John E
Purchase Details
Closed on
Jun 13, 1995
Sold by
Jameel B Dababneh
Bought by
Herbst Robert D and Herbst Susan E
Create a Home Valuation Report for This Property
The Home Valuation Report is an in-depth analysis detailing your home's value as well as a comparison with similar homes in the area
Home Values in the Area
Average Home Value in this Area
Purchase History
| Date | Buyer | Sale Price | Title Company |
|---|---|---|---|
| Peter William R | -- | None Available | |
| The Bank Of New York Mellon | -- | None Available | |
| Mortgage Electronic Registration Systems | $45,000 | None Available | |
| Schleicher Ryan | $123,500 | Metropolitan Title Company | |
| Citifinancial Mortgage Co Inc | $158,863 | -- | |
| Mcallister John E | $131,250 | -- | |
| Herbst Robert D | $81,000 | -- |
Source: Public Records
Tax History
| Year | Tax Paid | Tax Assessment Tax Assessment Total Assessment is a certain percentage of the fair market value that is determined by local assessors to be the total taxable value of land and additions on the property. | Land | Improvement |
|---|---|---|---|---|
| 2025 | $900 | $103,100 | $0 | $0 |
| 2024 | $876 | $96,600 | $0 | $0 |
| 2023 | $839 | $85,000 | $0 | $0 |
| 2022 | $2,439 | $75,900 | $0 | $0 |
| 2021 | $2,370 | $72,200 | $0 | $0 |
| 2020 | $2,338 | $64,700 | $0 | $0 |
| 2019 | $2,287 | $56,800 | $0 | $0 |
| 2018 | $755 | $47,700 | $0 | $0 |
| 2017 | $2,612 | $45,100 | $0 | $0 |
| 2016 | $2,035 | $40,500 | $0 | $0 |
| 2015 | $3,170 | $36,100 | $0 | $0 |
| 2013 | $2,930 | $29,900 | $0 | $0 |
| 2012 | $1,808 | $32,500 | $7,700 | $24,800 |
Source: Public Records
Map
Nearby Homes
- 9101 Sioux
- 9540 Mercedes
- 9624 Nathaline
- 9619 Mercedes
- 26760 Joy Rd Unit E8
- 26740 Joy Rd Unit 8
- 26710 Joy Rd Unit A
- 26710 Joy Rd Unit A, 10
- 8915 Sioux
- 9010 Leverne
- 26790 Joy Rd Unit 7
- 27007 Joy Rd
- 9983 Hemingway
- 9114 Cardwell St
- 9130 Kinloch
- 11377 Sioux
- 26030 W Chicago
- 11385 Leverne
- 11431 Columbia
- 11417 Leverne
Your Personal Tour Guide
Ask me questions while you tour the home.